FIGURE SUMMARY
Title

Analysis of a shark reveals ancient, Wnt-dependent, habenular asymmetries in vertebrates

Authors
Lanoizelet, M., Michel, L., Lagadec, R., Mayeur, H., Guichard, L., Logeux, V., Séverac, D., Martin, K., Klopp, C., Marcellini, S., Castillo, H., Pollet, N., Candal, E., Debiais-Thibaud, M., Boisvert, C., Billoud, B., Schubert, M., Blader, P., Mazan, S.
Source
Full text @ Nat. Commun.

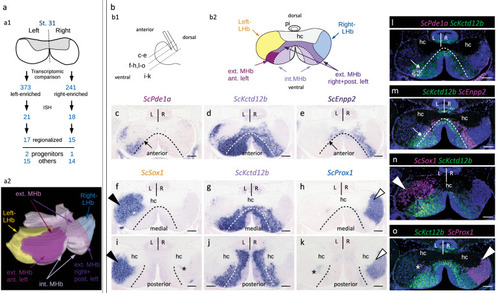
Developing catshark habenulae harbor major asymmetries both in lateral and medial compartments.

a Schemes showing the experimental strategy for the characterization of molecular asymmetries in catshark habenulae (a1) and the resulting 3D organization at stage 31 (a2). Anterior is to the left, dorsal to the top. b Schemes showing a left lateral view of catshark stage 31 habenulae, with section planes and levels indicated by dotted lines (b1), and the subdomain organization observed on a transverse section at a medial level (b2). co Transverse sections (dorsal to the top of each panel) after in situ hybridization (ISH) with probes for ScPde1a (c), ScKctd12b (d,g,j), ScEnpp2 (e), ScSox1 (f,i) and ScProx1 (h,k), and after fluorescent double ISH with probes for ScPde1a/ScKctd12b (l), ScKctd12b/ScEnpp2 (m), ScSox1/ScKctd12b (n) and ScKctd12b/ScProx1 (o). For fluorescent double ISH, signals for ScKctd12b are shown in green and those for ScPde1a, ScEnpp2, ScSox1 and ScProx1 in magenta. Sections (ck) were obtained from the same embryo. Black and white arrowheads in (f,h,i,k) respectively point to major lateral territories of ScSox1 and ScProx1. White arrowheads point to major ScSox1 and ScProx1 major lateral territories in (n) and (o) respectively. Asterisks in (i,k,o) show contra-lateral minor posterior territories. Dotted lines in (cm) delimit external and internal subdomains of the medial habenula, as inferred from the inner boundaries of ScPde1a and ScEnpp2 territories. Thin arrows in (c,e,l,m) point to the boundary between the complementary territories of ScPde1a and ScEnpp2 within the external MHb subdomain. Color code in (a2): yellow, Left-LHb; light purple, internal MHb; magenta, anterior, left-restricted component of external MHb; dark purple, right, plus posterior-left components of external MHb; blue, Right-LHb; hatched, pseudo-stratified neuroepithelium containing neural progenitors. Color code in (b2): same as in (a2); hatched, neural progenitors. The same ISH profiles were consistently obtained for each gene on at least five different specimens. Abbreviations: ant., anterior; post., posterior; ext., external; int., internal; MHb, medial habenula; LHb, lateral habenula; hc, habenular commissure; pi, pineal stalk; L, left; R, right; st., stage. Scale bar = 100 µm.

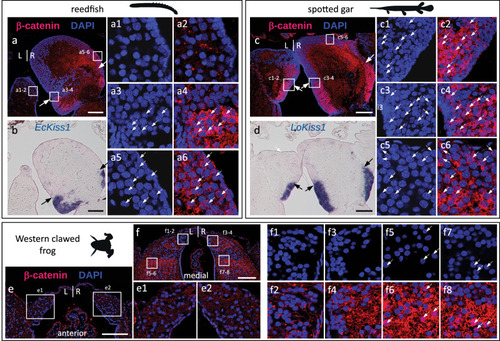
Asymmetries related to those observed in catshark lateral habenulae are present in a lungfish and a polypterid, but undetectable in members of tetrapods and neopterygians.

a,g,m Schemes showing the asymmetric organization of the catshark habenulae, with the reference signature markers of Left-LHb (a, yellow), MHb (g, purple) and Right-LHb (m, blue) considered for cross-species comparisons. bf,hl,nr Transverse sections of habenulae in the elephant shark (stage 36 embryo) (b,h,n), the reedfish (juvenile) (c,i,o), the spotted gar (juvenile) (d,j,p), the African lungfish (juvenile) (e,k,q) and the Western clawed frog (stage NF-66 tadpole) (f,l,r), following ISH with probes for orthologs of catshark markers for Left-LHb (bf), MHb (hl) and Right-LHb (nr). Dorsal is to the top in all panels and probe identity is indicated on each section. Black and white arrowheads in (bf) and (nr) respectively point to territories restricted to the left side and to the right side in the elephant shark, the reedfish and the lungfish, similar to the catshark, but bilateral in the spotted gar and the frog. Black arrows indicate the boundary between dorsal/medial and ventral/lateral habenulae. Dotted lines in (f,l,r) delineate the boundary between the lateral Sox1 habenular territory and the adjacent Prox1 territory in the frog. sw Schemes showing territories related to catshark Left-LHb (yellow), MHb (purple) and Right-LHb (blue) in the elephant shark (s), the reedfish (t), the spotted gar (u), the lungfish (v) and the frog (w), based on the set of signature markers analyzed. Only markers supporting these relationships are indicated for each species, with those also expressed in additional territories labeled by an asterisk (see expression details in Supplementary Fig. 711). The same ISH profiles were consistently obtained for each gene and each species on at least three different specimens. Abbreviations: L, left; R, right. Scale bar = 500 µm in (b,h,n), 200 µm in (c,d,i,j,o,p), 150 µm in (e,k,q), 100 µm in (f,l,r).

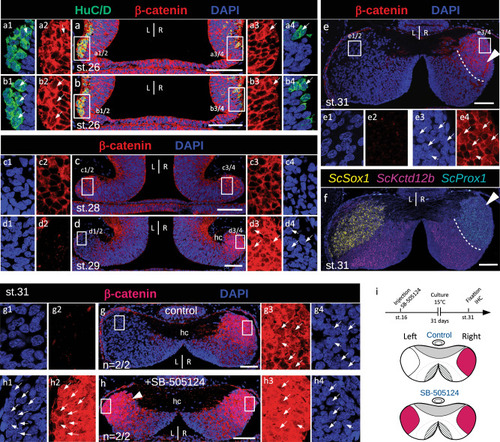
The nuclear β-catenin profile in developing catshark habenulae reveals dynamic, Nodal-dependent asymmetries.

ae Confocal images of transverse sections of catshark habenulae at stages 26 (a,b), 28 (c), 29 (d) and 31 (e) following DAPI staining (blue) and immunohistochemistry (IHC) with antibodies directed against β-catenin (red) (ae) and HuC/D (green) (a,b). f Hybridization chain reaction-based fluorescent in situ hybridization (HCR-FISH) image of a section adjacent to (e) with territories for ScSox1, ScKctd12b, and ScProx1 respectively in yellow, magenta and cyan. White arrowheads in (e,f) point to the Right-LHb. Dotted lines in (e,f) delimit Right-LHb and MHb subdomains, respectively positive for ScProx1 and ScKctd12b. The same β-catenin profiles were consistently obtained at each stage on at least three different specimens. g,h Confocal images of transverse sections of stage 31 catshark habenulae, after in ovo injection of DMSO (g, control) or SB-505124 (h) following neural tube closure. The section shown in (a) is located anteriorly to the one shown in (b), sections in (ch) are located at a medial organ level. A white arrowhead in (h) points to a lateral left territory showing a high density of β-catenin-positive nuclei, present in SB-505124-treated embryos but absent from control ones. i Schemes showing the experimental procedure and the habenular phenotypes observed, with lateral territories of nuclear β-catenin accumulation in red. Dorsal is to the top in all panels. Magnifications of boxed areas in (ae,g,h) are respectively shown in (a1a4,b1b4,c1c4,d1d4,e1e4,g1g4,h1h4). Thin white arrows point to β-catenin-labeled nuclei. Abbreviations: L, left; R, right; st., stage. Scale bar = 100 µm.

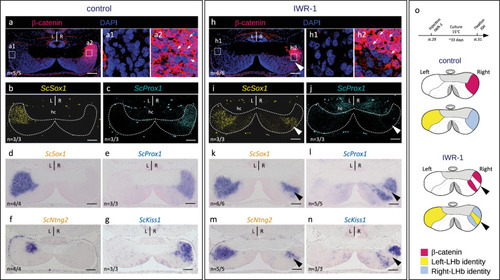
Inhibition of Wnt signaling converts lateral right into lateral left neuronal identities in developing catshark habenulae.

an Transverse sections of catshark stage 31 habenulae from control (ag) and IWR-1-treated (hn) embryos, after IHC with an antibody directed against β-catenin in red and DAPI-staining in blue (a,h), HCR-FISH double-labeling with territories of ScSox1 in yellow (b,i) and those of ScProx1 in cyan (c,j), ISH with probes for ScSox1 (d,k), ScProx1 (e,l), ScNtng2 (f,m) and ScKiss1 (g,n). Sections are shown at a medial organ level, dorsal to the top. (a) and (b,c) show adjacent sections of the same embryo, same for (d) and (e), (f) and (g), (h) and (i,j), (k) and (l), (m) and (n). (a1,a2) and (h1,h2) show magnifications of the territories boxed in (a) and (h), with β-catenin signals in red and DAPI signals in blue. Thin white arrows point to β-catenin labeled nuclei. Arrowheads in (in) show expansions of Left-LHb markers to the Right-LHb, in territories where expression of Right-LHb markers and nuclear β-catenin accumulation are lost. “n = “ in (an) refers to the number of embryos exhibiting the same phenotype as shown in the figure, over the total number of embryos analyzed, using the same detection method. o Schemes showing the experimental procedure used for pharmacological treatments and the resulting habenular phenotypes, with territories of nuclear β-catenin accumulation in red, territories of Left- and Right-LHb identity in yellow and blue respectively. Abbreviations: LHb, lateral habenula; L, left; R, right, st., stage. Scale bar = 100 µm.

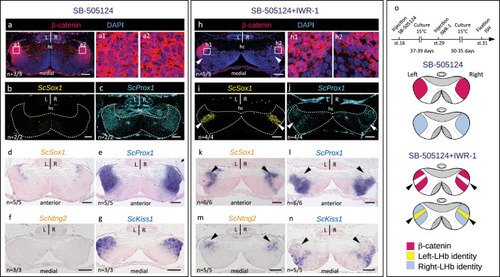
Inhibition of Wnt signaling rescues Left-LHb neuronal identities in the lateral habenulae of SB-505124-treated catshark embryos.

an Transverse sections of catshark stage 31 habenulae from SB-505124- (ag) and SB-505124- + IWR-1-treated (hn) embryos, after IHC with an antibody directed against β-catenin (β-catenin in red, DAPI-stained nuclei in blue) (a,h), HCR-FISH with territories of ScSox1 (b,i) and ScProx1 (c,j) in respectively yellow and cyan, ISH with probes for ScSox1 (d,k), ScProx1 (e,l), ScNtng2 (f,m) and ScKiss1 (g,n). Sections are shown at anterior (d,e,k,l) or medial (ac,fj,m,n) organ levels, dorsal to the top. (a) and (b,c) show sections of the same embryo, same for (d) and (e), (f) and (g), (h) and (ij), (k) and (l), (m) and (n). (a1,a2) and (h1,h2) show magnifications of the territories boxed in (a) and (h), with β-catenin signals in red and DAPI signals in blue. A right isomerism is observed following SB-505124 treatment (ag). Arrowheads in (hn) point to bilateral LHb sub-territories showing a Left-LHb identity in embryos co-treated with SB-505124 and IWR-1. “n = “ in (an) refers to the number of embryos exhibiting the same phenotype as shown in the figure, over the total number of embryos analyzed, using the same detection method. o Schemes showing the experimental procedure used for pharmacological treatments and the resulting habenular phenotypes, with territories of nuclear β-catenin accumulation in red, territories of Left- and Right-LHb identity in yellow and blue respectively. Arrowheads point to bilateral LHb sub-territories in embryos co-treated with SB-505124 and IWR-1. Abbreviations: hc, habenular commissure; L, left; R, right; st., stage. Scale bar = 100 µm.

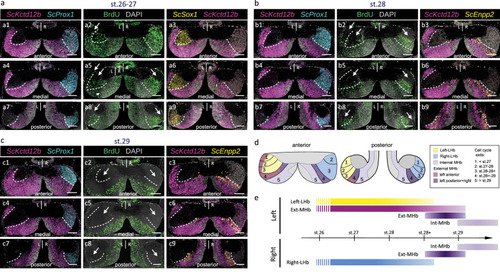
Spatial and temporal regulation of progenitor cell cycle exits in developing catshark habenulae.

ac Transverse sections of catshark stage 31 habenulae following exposure of embryos to BrdU pulses at stage 26–27 (a), 28 (b), and 29 (c), dorsal to the top. (a2,a5,a8,b2,b5,b8,c2,c5,c8) show confocal images following IHC using an antibody directed against BrdU (green), with DAPI-stained nuclei shown in gray. (a1,a4,a7,b1,b4,b7,c1,c4,c7), (a3,a6,a9), and (b3,b6,b9,c3,c6,c9) respectively show confocal images after double fluorescent ISH with probes for ScKctd12b/ScProx1 (magenta/cyan), ScSox1/ScKctd12b (yellow/magenta), and ScKctd12b/ScEnpp2 (magenta/yellow), with DAPI-stained nuclei in gray. (a1,a2,a3) show adjacent sections at an anterior level, same for (b1,b2,b3) and (c1,c2,c3). (a4,a5,a6) show adjacent sections at a medial level, same for (b4,b5,b6) and (c4,c5,c6). (a7,a8,a9) show adjacent sections at a posterior level, same for (b7,b8,b9) and (c7,c8,c9). White dotted lines delimit the border between medial (MHb) and lateral (LHb) territories as inferred from ScKctd12b expression, and its approximate location in adjacent BrdU-labeled sections. Thin arrows point to BrdU-negative territories. d Scheme showing the spatial distribution of territories exiting cell cycles earlier than stage 27 (1), during stages 27-28 (2), stages 28-28+ (3), stages 28 + -29 (4) and later than stage 29 (5), superimposed on the subdomain organization of catshark stage 31 habenulae. e Scheme showing the developmental windows when the broad territories of stage 31 catshark habenulae exit cell cycles. Data from Supplementary Fig. 16 are taken into account in (d) and (e). Color code in (d,e) as in Fig. 1a2,b2. Assays at each incorporation stage were replicated at least three times, with the same results. Abbreviations: LHb, lateral habenula; MHb, medial habenula; L, left; R, right; st., stage. Scale bar = 100 µm.

Evolution of nuclear β-catenin asymmetry patterns in the habenulae of jawed vertebrates.
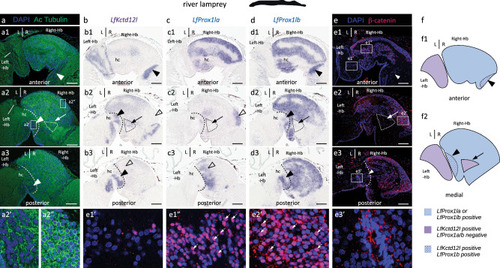
af Transverse sections of habenulae from the reedfish (juvenile) (a,b), the spotted gar (juvenile) (c,d) and the Western clawed frog (NF-66 tadpole) (e,f), after IHC using an antibody directed against β-catenin (red) with DAPI-stained nuclei in blue (a,c,e,f) and after ISH with probes for Kiss1 orthologs (b,d). Dorsal is to the top in all panels. Arrows in (a,b,c,d) indicate the boundary between ventral, Kiss1-positive territories, and dorsal territories. (a1a6), (c1c6), (e1e2) and (f1f8) show higher magnifications of territories boxed in (a), (c), (e) and (f) respectively, with DAPI staining shown in (a1a3,c1,c3,c5,f1,f3,f5,f7) and merged signals for DAPI (blue) and β-catenin (red) shown in (a2,a4,a6,c2,c4,c6,e1,e2,f2,f4,f6,f8). White arrows in (a3a6,c1c6,f5f8) point to β-catenin-positive nuclei. Identical nuclear β-catenin profiles were consistently obtained for each species on at least two specimens. Abbreviations: L, left; R, right. Scale bars = 100 µm.

Expressions of Prox1 paralogues and nuclear distribution of β-catenin are right-restricted in the habenulae of the river lamprey.

a,e Confocal images of transverse sections of adult river lamprey habenulae following DAPI staining (blue) and IHC with antibodies directed against acetylated tubulin (green) (a) and β-catenin (red) (e). Higher magnification of the territories boxed in (a2), (e1), (e2) and (e3) are shown in (a2’,a2”), (e1’,e1”), (e2’) and (e3’), respectively. b,c,d Transverse sections of river lamprey habenulae following ISH with probes for LfKctd12l (b), LfProx1la (c) and LfProx1lb (d). Sections in (b,c,d) were obtained from the same specimen. Sections shown in (a1a3), (b1b3,) (c1c3), (d1d3), and (e1e3) are anterior to posterior series. White arrrowheads in (a) and black arrowheads in (b,d) point to two territories, which express both LfKctd12l and LfProx1lb in the right habenula: one, delimited by dashed lines in (a2,a3,b2,b3,c2,c3,d2,d3,e3), is located posteriorly and adjacent to the midline, while the other, shown in (a1,b1,d1,e1), is restricted to ventral and anterior levels. Empty arrowheads in (b2,b3,c2,c3) point to discrete posterior LfProx1la territories negative for LfKctd12l. A thin arrow in (a2,b2,c2,d2,e2) points to a right medial territory, delimited by a dotted line, which expresses LfKctd12l, but neither LfProx1la, nor LfProx1lb. Small arrowheads in (e1’,e2’) point to β-catenin- positive nuclei. f Schemes showing the subdomain organization of river lamprey habenulae observed on transverse sections at anterior and medial levels. Color code: blue, territories expressing at least one of the two LfProx1la/b paralogs; purple, territories expressing LfKctd12l, but neither LfProx1la, nor LfProx1lb; dotted purple/blue, territories expressing both LfKctd12l and LfProx1lb. Each ISH and IHC experiment was replicated on at least three different specimens with the same results. Abbreviations: Hb, habenula; hc, habenular commissure; L, left; R, right. Scale bar = 100 µm.

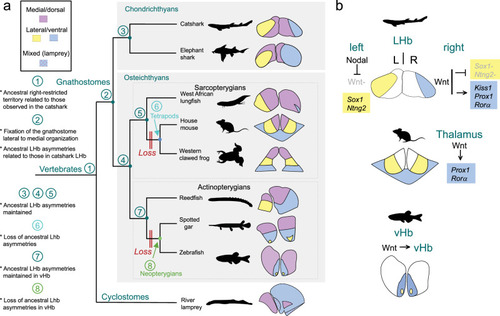
Evolution of habenular asymmetries in jawed vertebrates.

a Evolution of the organization and the asymmetries of habenulae across vertebrates. Schemes on the right show the general subdomain organization of habenulae in members of the major vertebrate phyla. In gnathostomes, medial/dorsal territories are shown in purple, and lateral/ventral territories in yellow for territories of neuronal identity related to catshark Left-LHb or blue for territories of neuronal identity related to catshark Right-LHb. In the lamprey, territories related to the catshark medial and lateral right habenulae (respectively in purple and blue) are shown with the same color codes. Territories of mixed identity, co-expressing markers of medial and lateral right habenulae, are shown dotted in this species. Numbers at the nodes of the tree refer to the ancestral asymmetry profile inferred from comparative analyzes. The phylogenetic distribution of asymmetries suggests that a right restriction of neuronal identities related to those observed in the catshark lateral right habenula is an ancestral vertebrate feature (node 1 of the tree). The typical lateral to medial organization of habenulae, with lateral habenula asymmetries related to those observed in the catshark, were fixed in the gnathostome lineage, prior to its radiation (node 2). Lateral habenula asymmetries were maintained in chondrichthyans (node 3), as well as in ancestral osteichthyans, actinopterygians and sarcopterygians (nodes 4,5,7). They were independently lost in tetrapods (node 6) and neopterygians (node 8). b Differential deployment of an ancestral Wnt dependent regulatory module across jawed vertebrates. Functional analyzes in the mouse and in the catshark suggest that the Wnt signaling dependence of Prox1/Rorα expressions may reflect an ancient regulatory module, recruited to shape neuronal identities in the dorsal thalamus of tetrapods. In the catshark, the lateral right Kiss1 expression is also Wnt-dependent and the repression of Wnt by Nodal on the left side results in lateral Sox1 and Ntng2 expressions. In the zebrafish, Wnt signaling is required for ventral habenula formation, and possible later roles of the Wnt pathway in the elaboration of neuronal identities in this territory remain to be assessed. Abbreviations: LHb, lateral habenula; vHb, ventral habenula; L, left; R, right.

Acknowledgments
This image is the copyrighted work of the attributed author or publisher, and ZFIN has permission only to display this image to its users. Additional permissions should be obtained from the applicable author or publisher of the image. Full text @ Nat. Commun.