|
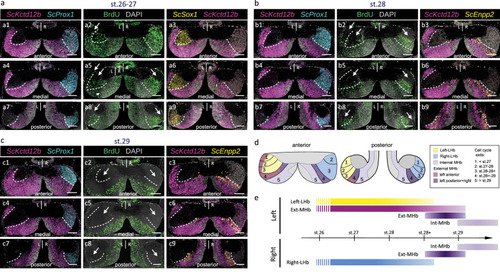
Spatial and temporal regulation of progenitor cell cycle exits in developing catshark habenulae. a–c Transverse sections of catshark stage 31 habenulae following exposure of embryos to BrdU pulses at stage 26–27 (a), 28 (b), and 29 (c), dorsal to the top. (a2,a5,a8,b2,b5,b8,c2,c5,c8) show confocal images following IHC using an antibody directed against BrdU (green), with DAPI-stained nuclei shown in gray. (a1,a4,a7,b1,b4,b7,c1,c4,c7), (a3,a6,a9), and (b3,b6,b9,c3,c6,c9) respectively show confocal images after double fluorescent ISH with probes for ScKctd12b/ScProx1 (magenta/cyan), ScSox1/ScKctd12b (yellow/magenta), and ScKctd12b/ScEnpp2 (magenta/yellow), with DAPI-stained nuclei in gray. (a1,a2,a3) show adjacent sections at an anterior level, same for (b1,b2,b3) and (c1,c2,c3). (a4,a5,a6) show adjacent sections at a medial level, same for (b4,b5,b6) and (c4,c5,c6). (a7,a8,a9) show adjacent sections at a posterior level, same for (b7,b8,b9) and (c7,c8,c9). White dotted lines delimit the border between medial (MHb) and lateral (LHb) territories as inferred from ScKctd12b expression, and its approximate location in adjacent BrdU-labeled sections. Thin arrows point to BrdU-negative territories. d Scheme showing the spatial distribution of territories exiting cell cycles earlier than stage 27 (1), during stages 27-28 (2), stages 28-28+ (3), stages 28 + -29 (4) and later than stage 29 (5), superimposed on the subdomain organization of catshark stage 31 habenulae. e Scheme showing the developmental windows when the broad territories of stage 31 catshark habenulae exit cell cycles. Data from Supplementary Fig. 16 are taken into account in (d) and (e). Color code in (d,e) as in Fig. 1a2,b2. Assays at each incorporation stage were replicated at least three times, with the same results. Abbreviations: LHb, lateral habenula; MHb, medial habenula; L, left; R, right; st., stage. Scale bar = 100 µm.
|