|
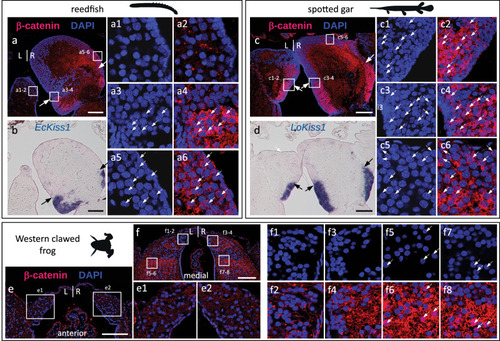
Evolution of nuclear β-catenin asymmetry patterns in the habenulae of jawed vertebrates. a–f Transverse sections of habenulae from the reedfish (juvenile) (a,b), the spotted gar (juvenile) (c,d) and the Western clawed frog (NF-66 tadpole) (e,f), after IHC using an antibody directed against β-catenin (red) with DAPI-stained nuclei in blue (a,c,e,f) and after ISH with probes for Kiss1 orthologs (b,d). Dorsal is to the top in all panels. Arrows in (a,b,c,d) indicate the boundary between ventral, Kiss1-positive territories, and dorsal territories. (a1–a6), (c1–c6), (e1–e2) and (f1–f8) show higher magnifications of territories boxed in (a), (c), (e) and (f) respectively, with DAPI staining shown in (a1–a3,c1,c3,c5,f1,f3,f5,f7) and merged signals for DAPI (blue) and β-catenin (red) shown in (a2,a4,a6,c2,c4,c6,e1,e2,f2,f4,f6,f8). White arrows in (a3–a6,c1–c6,f5–f8) point to β-catenin-positive nuclei. Identical nuclear β-catenin profiles were consistently obtained for each species on at least two specimens. Abbreviations: L, left; R, right. Scale bars = 100 µm.
|