
- Title
-
Unveiling tryptophan dynamics and functions across model organisms via quantitative imaging
- Authors
- Wang, K., Chen, T.L., Zhang, X.X., Cao, J.B., Wang, P., Wang, M., Du, J.L., Mu, Y., Tao, R.
- Source
- Full text @ BMC Biol.
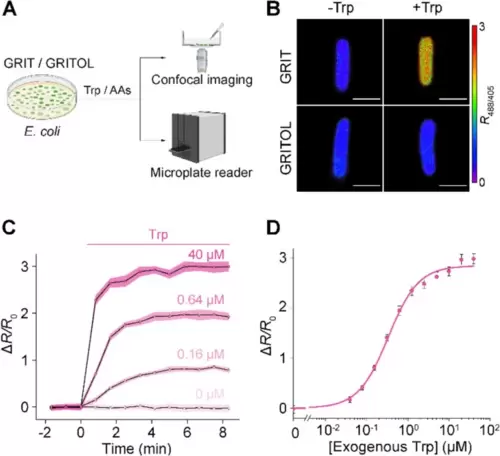
Detection of tryptophan uptake in bacteria with GRIT sensor. A Schematic representation illustrating the fluorescence detection of tryptophan (Trp) dynamics with the GRIT or GRITOL sensor in Escherichia coli cells. B Fluorescence images of bacteria expressing GRIT and GRITOL upon the addition of 0.1 mM Trp. C Changes in the fluorescence of GRIT in response to various concentrations of Trp in Escherichia coli. D The dose–response curve of GRIT-positive bacteria treated with exogenous Trp. Data are from Fig. S1A. The curve was fitted using Eq. 1 provided in the “Methods” section, with the binding constant being ~ 0.33 μM. Scale bars, 1 μm. Data shown as mean ± s.e.m., n = 3 independent experiments in C and D. See also Additional file 1: Fig. S1 and Table S1 |
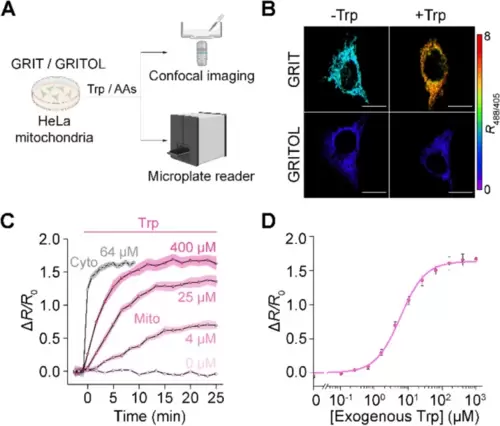
GRIT sensor reports mitochondrial tryptophan dynamics in cultured HeLa cells. A Schematic showing the fluorescence detection with mito-GRIT or mito-GRITOL sensor in HeLa cells. B Fluorescence responses of HeLa cells expressing GRIT (upper) and GRITOL (bottom) in mitochondria upon the addition of exogenous 0.5 mM Trp in HBSS buffer. The traces (C) and dose-dependence curve (D) of mitochondrial GRIT sensor in response to varying concentrations of added tryptophan. The gray trace in C represents the fluorescence response kinetics of cytosolic GRIT to indicated Trp concentration (64 μM) in HBSS buffer, suggesting a significantly faster tryptophan uptake into the cytosol compared to the mitochondria. The curve in D was fitted using Eq. 1 provided in the “Methods” section, with the binding constant being ~ 5.84 μM. Scale bars, 10 μm. Data shown as mean ± s.e.m. n = 3 independent experiments. See also Additional file 1: Fig. S2 and Tables S1 and S2 |
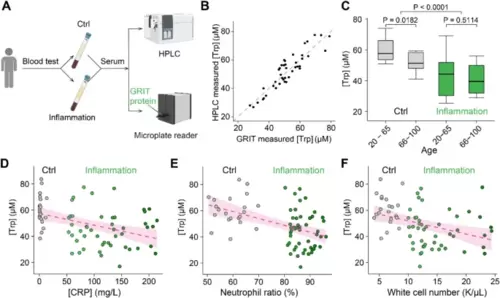
Decreased serum tryptophan concentration is a biochemical mark of inflamed patients. A Schematic of the experimental procedures for the quantification of human serum tryptophan. B A comparative analysis of quantitative serum tryptophan level in identical samples measured by GRIT sensor assay or HPLC measurement (n = 42). C Tryptophan concentrations of human serum samples in the control group (gray, n = 12 in 20–65 subgroup, n = 13 in the 66–100 subgroup) and inflammation group (green, n = 17 in 20–65 subgroup, n = 35 in the 66–100 subgroup) based on age. Note that the total n number (42) in B is smaller than the n number (77) in C, due to the volume of some serum samples were not enough for GRIT sensor assay after HPLC (< 0.3 mL). Relationships between tryptophan concentrations in human serum samples and concentrations of hypersensitive C-reactive protein D, neutrophil ratio E, and white cell number F. The dashed magenta line represents a linear fit of the data, with the shaded area indicating the fitting confidence interval. Two-tailed Student’s unpaired t-test for C. See also Additional file 1: Fig. S3 and Table S1 |
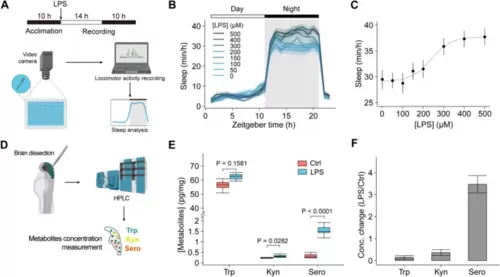
Detection of metabolite levels in zebrafish larvae and zebrafish sleep changes during inflammation. A Schematic of the zebrafish sleep behavior measurement during inflammation. B Changes in the sleep time of zebrafish in response to various concentrations of LPS (n = 60 fishes from 5 to 7 independent experiments). LPS was added at 0 h with indicated concentrations. C The dose–response curve of mean sleep time at night of zebrafish treated with different concentrations of LPS. The curve was fitted to a sigmoidal function. D Schematic of the experimental procedures for the quantification of zebrafish brain tryptophan. The absolute levels (pg/mg) (E) and relative changes (F) of tryptophan, kynurenine, and serotonin in isolated zebrafish brain with (n = 7) or without LPS treatment (n = 6). Data shown as mean ± s.e.m. Two-tailed unpaired Student’s t-test for D. See also Additional file 1: Fig. S4 |
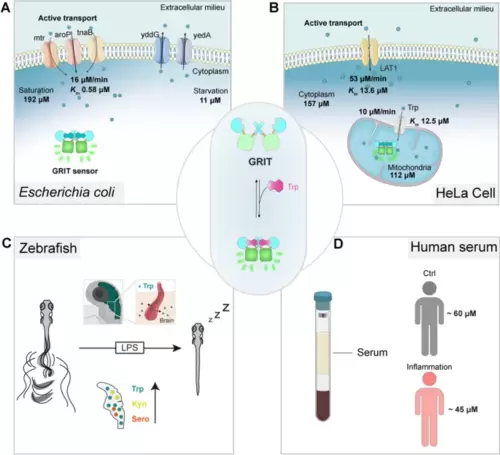
The proposed biophysical models of tryptophan dynamics in bacteria, mammalian cells, zebrafish, and human serum. A Pathways contributing to tryptophan metabolism in bacteria. Bacteria absorb external tryptophan mainly by aroP and export excess tryptophan with yddG and yedA. Gut microbe could utilize tryptophan to synthesize indole compounds to regulate neuron activities. B Proposed model for the tryptophan metabolism in the mitochondria of mammalian cells. Tryptophan enters mitochondria as the speed of 10 μM/min. Mitochondrial tryptophan pool depends on the cytosolic influx and endogenous consumption. C Proposed model of tryptophan dynamics in zebrafish larvae under LPS-induced inflammation. During inflammation, plasma tryptophan enters the brain and increases the levels of kynurenine and serotonin, leading to prolonged sleep time of zebrafish larvae. D The serum tryptophan levels in inflamed patients and control individuals. All the uptake rates or efflux rates are calculated at the Trp concentration around the Michaelis constant (Km) of relative transporters |