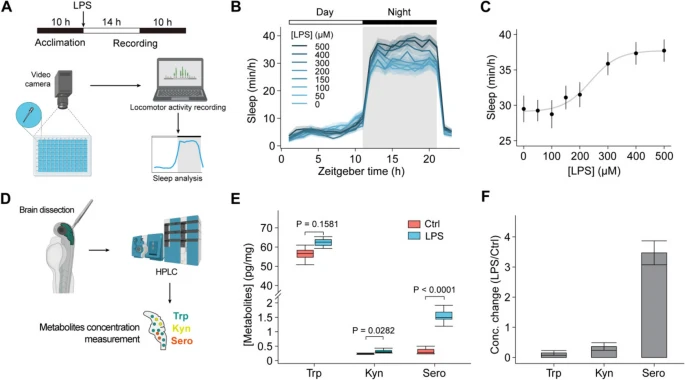
Fig. 4 Detection of metabolite levels in zebrafish larvae and zebrafish sleep changes during inflammation. A Schematic of the zebrafish sleep behavior measurement during inflammation. B Changes in the sleep time of zebrafish in response to various concentrations of LPS (n = 60 fishes from 5 to 7 independent experiments). LPS was added at 0 h with indicated concentrations. C The dose–response curve of mean sleep time at night of zebrafish treated with different concentrations of LPS. The curve was fitted to a sigmoidal function. D Schematic of the experimental procedures for the quantification of zebrafish brain tryptophan. The absolute levels (pg/mg) (E) and relative changes (F) of tryptophan, kynurenine, and serotonin in isolated zebrafish brain with (n = 7) or without LPS treatment (n = 6). Data shown as mean ± s.e.m. Two-tailed unpaired Student’s t-test for D. See also Additional file 1: Fig. S4
Image
Figure Caption
Acknowledgments
This image is the copyrighted work of the attributed author or publisher, and
ZFIN has permission only to display this image to its users.
Additional permissions should be obtained from the applicable author or publisher of the image.
Full text @ BMC Biol.

