
Fig. 4
- ID
- ZDB-FIG-241203-16
- Publication
- Wang et al., 2024 - Unveiling tryptophan dynamics and functions across model organisms via quantitative imaging
- Other Figures
- All Figure Page
- Back to All Figure Page
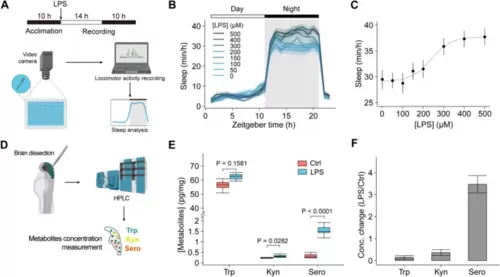
Detection of metabolite levels in zebrafish larvae and zebrafish sleep changes during inflammation. A Schematic of the zebrafish sleep behavior measurement during inflammation. B Changes in the sleep time of zebrafish in response to various concentrations of LPS (n = 60 fishes from 5 to 7 independent experiments). LPS was added at 0 h with indicated concentrations. C The dose–response curve of mean sleep time at night of zebrafish treated with different concentrations of LPS. The curve was fitted to a sigmoidal function. D Schematic of the experimental procedures for the quantification of zebrafish brain tryptophan. The absolute levels (pg/mg) (E) and relative changes (F) of tryptophan, kynurenine, and serotonin in isolated zebrafish brain with (n = 7) or without LPS treatment (n = 6). Data shown as mean ± s.e.m. Two-tailed unpaired Student’s t-test for D. See also Additional file 1: Fig. S4 |