
Fig. 1
- ID
- ZDB-FIG-241203-13
- Publication
- Wang et al., 2024 - Unveiling tryptophan dynamics and functions across model organisms via quantitative imaging
- Other Figures
- All Figure Page
- Back to All Figure Page
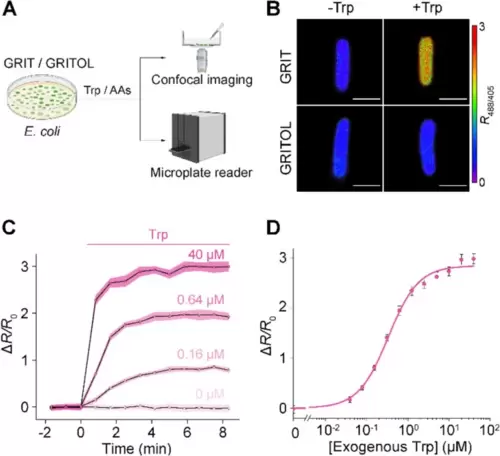
Detection of tryptophan uptake in bacteria with GRIT sensor. A Schematic representation illustrating the fluorescence detection of tryptophan (Trp) dynamics with the GRIT or GRITOL sensor in Escherichia coli cells. B Fluorescence images of bacteria expressing GRIT and GRITOL upon the addition of 0.1 mM Trp. C Changes in the fluorescence of GRIT in response to various concentrations of Trp in Escherichia coli. D The dose–response curve of GRIT-positive bacteria treated with exogenous Trp. Data are from Fig. S1A. The curve was fitted using Eq. 1 provided in the “Methods” section, with the binding constant being ~ 0.33 μM. Scale bars, 1 μm. Data shown as mean ± s.e.m., n = 3 independent experiments in C and D. See also Additional file 1: Fig. S1 and Table S1 |