
Fig. 2
- ID
- ZDB-FIG-241203-14
- Publication
- Wang et al., 2024 - Unveiling tryptophan dynamics and functions across model organisms via quantitative imaging
- Other Figures
- All Figure Page
- Back to All Figure Page
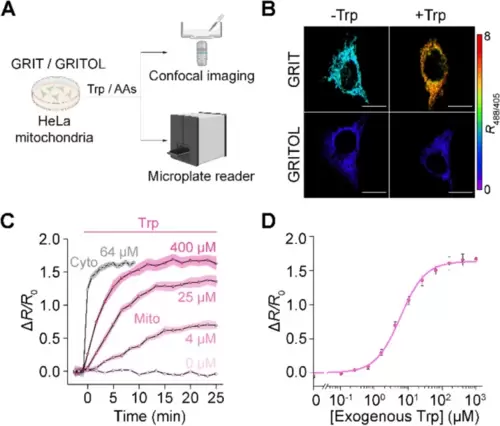
GRIT sensor reports mitochondrial tryptophan dynamics in cultured HeLa cells. A Schematic showing the fluorescence detection with mito-GRIT or mito-GRITOL sensor in HeLa cells. B Fluorescence responses of HeLa cells expressing GRIT (upper) and GRITOL (bottom) in mitochondria upon the addition of exogenous 0.5 mM Trp in HBSS buffer. The traces (C) and dose-dependence curve (D) of mitochondrial GRIT sensor in response to varying concentrations of added tryptophan. The gray trace in C represents the fluorescence response kinetics of cytosolic GRIT to indicated Trp concentration (64 μM) in HBSS buffer, suggesting a significantly faster tryptophan uptake into the cytosol compared to the mitochondria. The curve in D was fitted using Eq. 1 provided in the “Methods” section, with the binding constant being ~ 5.84 μM. Scale bars, 10 μm. Data shown as mean ± s.e.m. n = 3 independent experiments. See also Additional file 1: Fig. S2 and Tables S1 and S2 |