
|
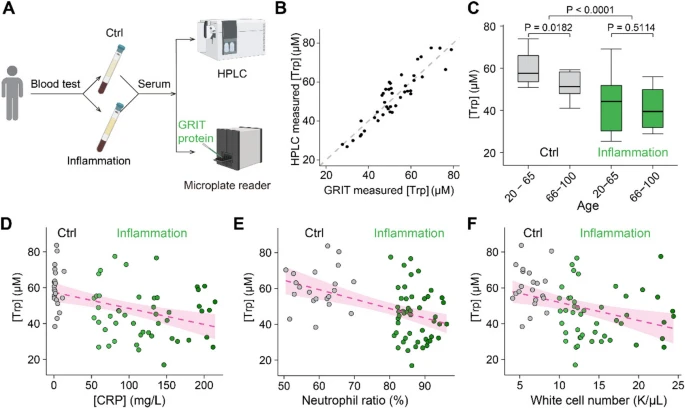
Fig. 3 Decreased serum tryptophan concentration is a biochemical mark of inflamed patients. A Schematic of the experimental procedures for the quantification of human serum tryptophan. B A comparative analysis of quantitative serum tryptophan level in identical samples measured by GRIT sensor assay or HPLC measurement (n = 42). C Tryptophan concentrations of human serum samples in the control group (gray, n = 12 in 20–65 subgroup, n = 13 in the 66–100 subgroup) and inflammation group (green, n = 17 in 20–65 subgroup, n = 35 in the 66–100 subgroup) based on age. Note that the total n number (42) in B is smaller than the n number (77) in C, due to the volume of some serum samples were not enough for GRIT sensor assay after HPLC (< 0.3 mL). Relationships between tryptophan concentrations in human serum samples and concentrations of hypersensitive C-reactive protein D, neutrophil ratio E, and white cell number F. The dashed magenta line represents a linear fit of the data, with the shaded area indicating the fitting confidence interval. Two-tailed Student’s unpaired t-test for C. See also Additional file 1: Fig. S3 and Table S1