
- Title
-
Impact of sleep problems on the cardiometabolic risks: an integrated epidemiological and metabolomics study
- Authors
- Chen, M., Ouyang, Y., Yang, Y., Liu, Z., Zhao, M.
- Source
- Full text @ Diabetol Metab Syndr
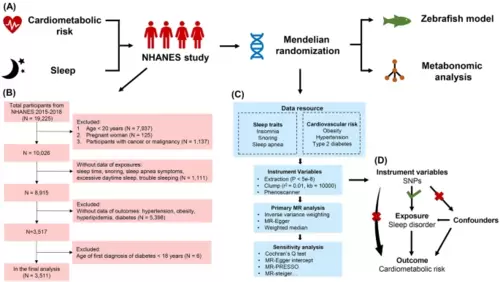
Research scheme and flowchart of data process. (A) The schematic illustration comprised the NHANES study, Mendelian randomization analysis, zebrafish model construction, and metabolomics analysis. (B) The flowchart of the participants from NHANES 2015–2018. (C) Data resource and study design of our MR analysis. (D) Three assumptions in the MR analysis |
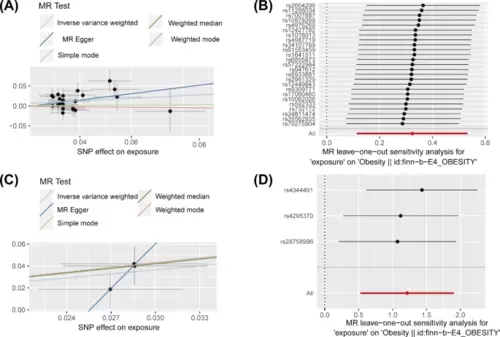
Significant Mendelian randomization results. (A) Scatter plot and (B) leave-one-out analysis of snoring on obesity. (C) Scatter plot and (D) leave-one-out analysis of sleep apnea on obesity |
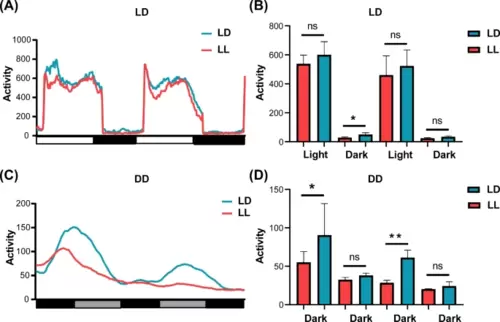
Activity evaluation in the zebrafish model. (A, C) Curve graph of activity level alteration accompanied with the time of LD and LL group under the condition of (A) LD or (C) DD. (B, D) Comparison of mean activity levels of LD and LL groups in different periods (Light or Dark) under the condition of (B) LD or (D) DD |
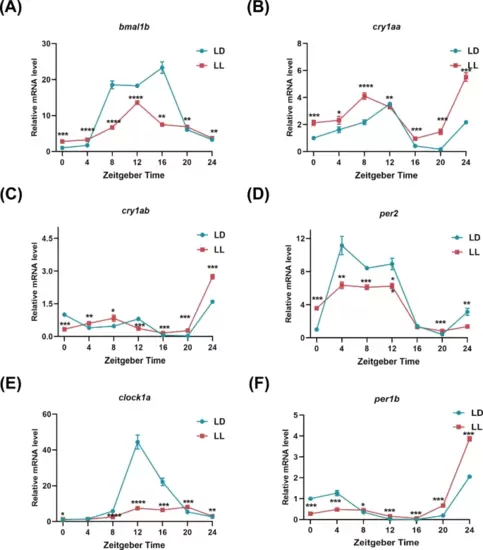
Expression level of circadian rhythm genes in the zebrafish model. (A-F) Expression levels of (A) bmal1b, (B) cry1aa, (C) cry1ab, (D) per2, (E) clock 1a, (F) per1b in 24 h of LD and LL groups |
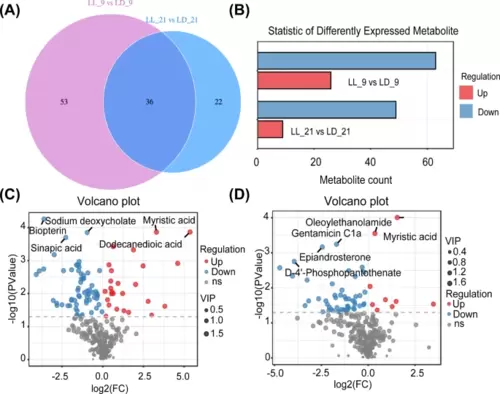
Disturbed metabolism after sleep disorder based on the metabolomics results. (A, B) (A) Statistic and (B) Venn diagram of differentially expressed metabolites in 9 (LL_9 vs. LD_9) and 21 (LL_21 vs. LD_21) o’clock group. (C, D) Scatter plots of mass-to-charge ratio and P-value of differentially expressed metabolites in (C) 9 and (D) 21 o’clock group |
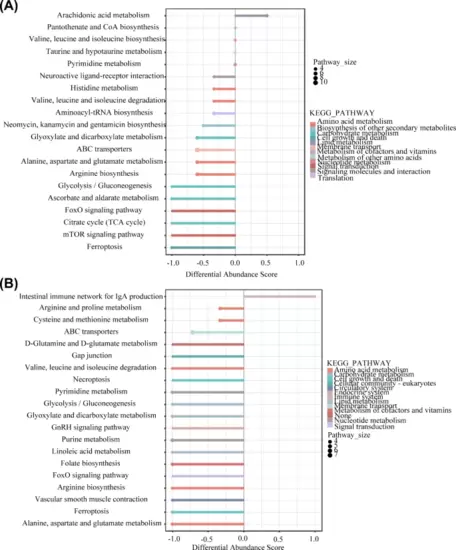
Differential enrichment score map of metabolic pathways. (A, B) Differential abundance (DA) score map of (A) 9 and (B) 21 o’clock group. The ordinate is the metabolic pathway, and the size of the point at the top of the column indicates the number of differential metabolites enriched in this pathway |