
FIGURE
Fig. 5
- ID
- ZDB-FIG-241203-22
- Publication
- Chen et al., 2024 - Impact of sleep problems on the cardiometabolic risks: an integrated epidemiological and metabolomics study
- Other Figures
- All Figure Page
- Back to All Figure Page
Fig. 5
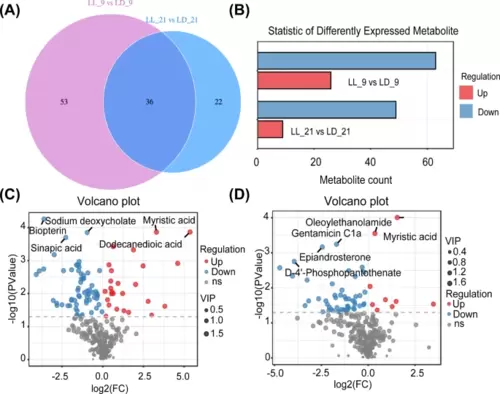
Disturbed metabolism after sleep disorder based on the metabolomics results. (A, B) (A) Statistic and (B) Venn diagram of differentially expressed metabolites in 9 (LL_9 vs. LD_9) and 21 (LL_21 vs. LD_21) o’clock group. (C, D) Scatter plots of mass-to-charge ratio and P-value of differentially expressed metabolites in (C) 9 and (D) 21 o’clock group |
Expression Data
Expression Detail
Antibody Labeling
Phenotype Data
Phenotype Detail
Acknowledgments
This image is the copyrighted work of the attributed author or publisher, and
ZFIN has permission only to display this image to its users.
Additional permissions should be obtained from the applicable author or publisher of the image.
Full text @ Diabetol Metab Syndr