
FIGURE
Fig. 3
- ID
- ZDB-FIG-241203-20
- Publication
- Chen et al., 2024 - Impact of sleep problems on the cardiometabolic risks: an integrated epidemiological and metabolomics study
- Other Figures
- All Figure Page
- Back to All Figure Page
Fig. 3
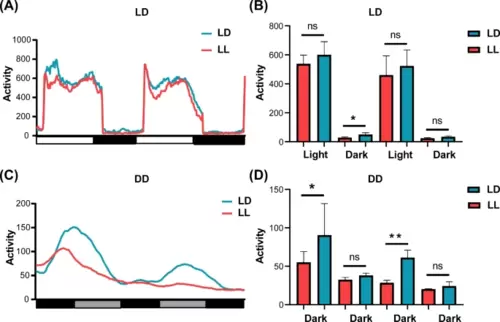
Activity evaluation in the zebrafish model. (A, C) Curve graph of activity level alteration accompanied with the time of LD and LL group under the condition of (A) LD or (C) DD. (B, D) Comparison of mean activity levels of LD and LL groups in different periods (Light or Dark) under the condition of (B) LD or (D) DD |
Expression Data
Expression Detail
Antibody Labeling
Phenotype Data
Phenotype Detail
Acknowledgments
This image is the copyrighted work of the attributed author or publisher, and
ZFIN has permission only to display this image to its users.
Additional permissions should be obtained from the applicable author or publisher of the image.
Full text @ Diabetol Metab Syndr