
FIGURE
Fig. 6
- ID
- ZDB-FIG-241203-23
- Publication
- Chen et al., 2024 - Impact of sleep problems on the cardiometabolic risks: an integrated epidemiological and metabolomics study
- Other Figures
- All Figure Page
- Back to All Figure Page
Fig. 6
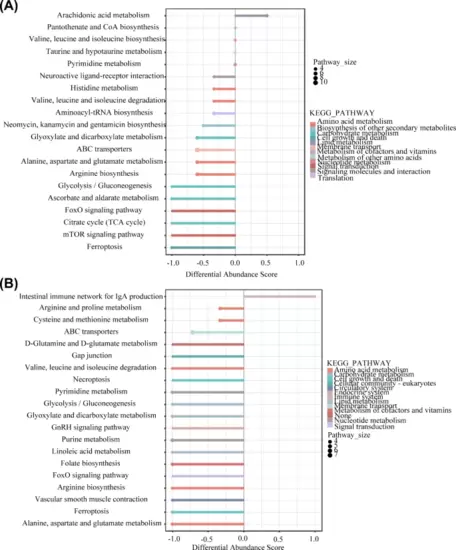
Differential enrichment score map of metabolic pathways. (A, B) Differential abundance (DA) score map of (A) 9 and (B) 21 o’clock group. The ordinate is the metabolic pathway, and the size of the point at the top of the column indicates the number of differential metabolites enriched in this pathway |
Expression Data
Expression Detail
Antibody Labeling
Phenotype Data
Phenotype Detail
Acknowledgments
This image is the copyrighted work of the attributed author or publisher, and
ZFIN has permission only to display this image to its users.
Additional permissions should be obtained from the applicable author or publisher of the image.
Full text @ Diabetol Metab Syndr