
Image
|
Figure Caption
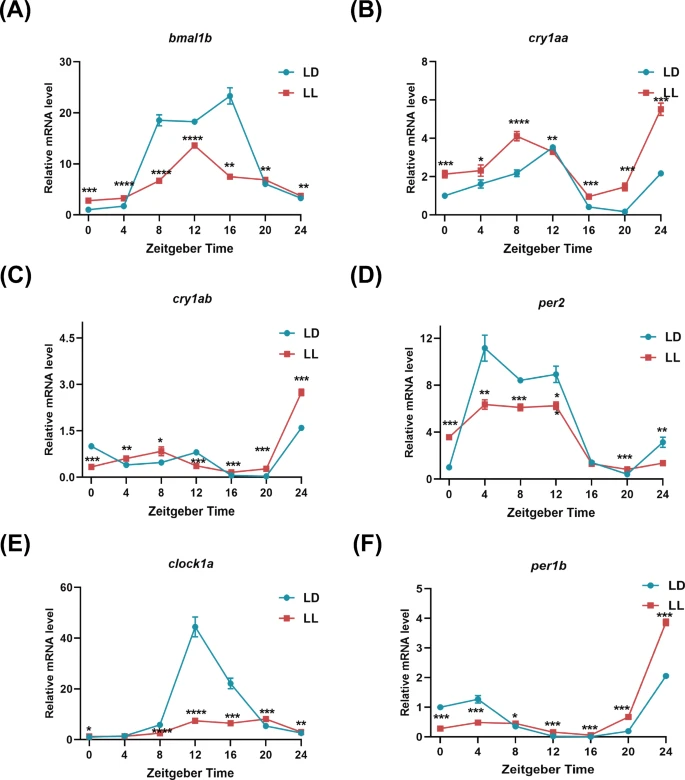
Fig. 4 Expression level of circadian rhythm genes in the zebrafish model. (A-F) Expression levels of (A) bmal1b, (B) cry1aa, (C) cry1ab, (D) per2, (E) clock 1a, (F) per1b in 24 h of LD and LL groups
Acknowledgments
This image is the copyrighted work of the attributed author or publisher, and
ZFIN has permission only to display this image to its users.
Additional permissions should be obtained from the applicable author or publisher of the image.
Full text @ Diabetol Metab Syndr