
Image
|
Figure Caption
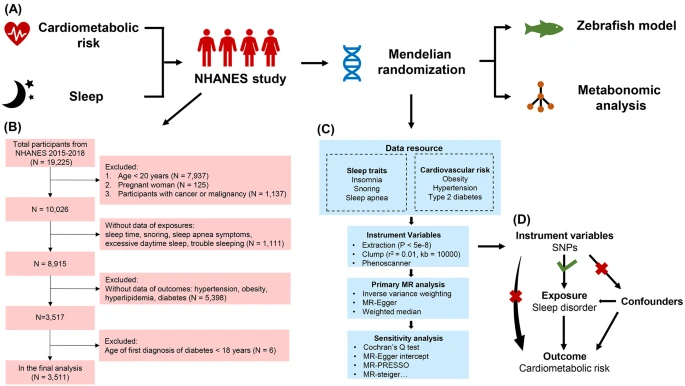
Fig. 1 Research scheme and flowchart of data process. (A) The schematic illustration comprised the NHANES study, Mendelian randomization analysis, zebrafish model construction, and metabolomics analysis. (B) The flowchart of the participants from NHANES 2015–2018. (C) Data resource and study design of our MR analysis. (D) Three assumptions in the MR analysis
Acknowledgments
This image is the copyrighted work of the attributed author or publisher, and
ZFIN has permission only to display this image to its users.
Additional permissions should be obtained from the applicable author or publisher of the image.
Full text @ Diabetol Metab Syndr