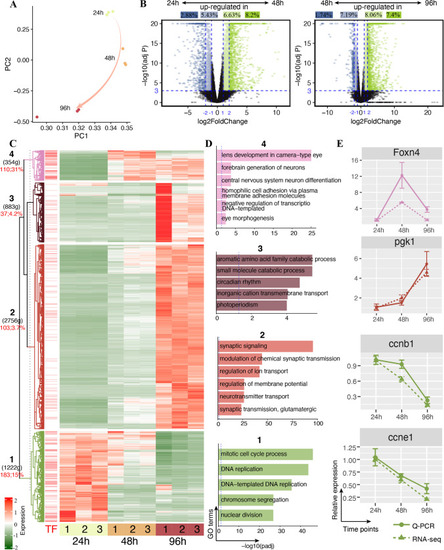
Differentially expressed protein-coding genes (DEGs) in developing zebrafish head transcriptome. A Sample distribution according to the PCA analysis. B Volcano plots of DEGs by neighbor time point comparisons. Dark colors depict large change of genes (LFC ≥ 2) while light colors depict moderate change of genes (1 ≤ LFC < 2). C Expression patterns of DEGs by pairwise comparisons and were divided into four clusters. D GO biological process enrichment analysis of DEGs in four clusters. E RT-qPCR validation of four genes in RNA-seq datasets

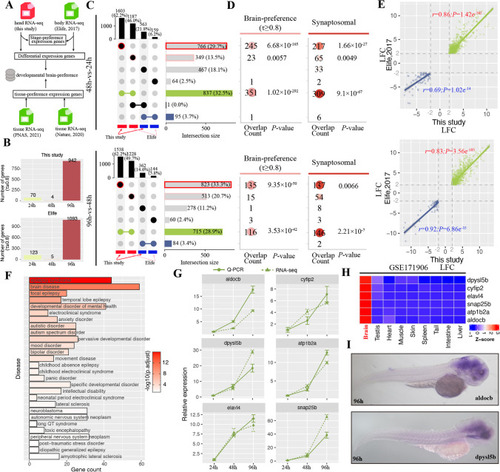
Significant enrichment of brain-preference genes in head transcriptome compared to that in the whole embryo RNA-seq. A Overview of identification of developmental brain-preference genes by integrating datasets from this study and other publication. B Number of stage-specific expression genes. C The upset plots of up- and down-regulated DEGs between head and whole embryo developmental RNA-seq. D Significant enrichment of brain-preference and synaptosome genes in DEGs only detected from head transcriptome. E High correlation of DEGs detected both in head and whole embryo transcriptome based on log2-transformed fold-change. F Disease enrichment of developmental brain-preference genes. G RT-qPCR validation of genes with preferred expression in brain. H In situ hybridization of protein-coding genes, aldocb and dpysl5b

Snap25b knockout causes embryonic development defects and decreases swimming activity. The snap25b gene structure and the schema for CRISPR-Cas9 technology to reduce snap25b expression in zebrafish. B Sanger sequencing confirms the mutations caused by CRIPSR-Cas9 in F0 and F1 generations. Primary sequence was shown. C In situ hybridization of snap25b in wild-type (WT) and snap25b mutant zebrafish. D The expression of snap25b by RT-qPCR in the head of wild-type and snap25b mutant zebrafish. E The representative abnormal phenotype included developmental delay, curled tail, and agenesis of eye. F The summary of survival rate in wild-type and snap25b mutants. G The summary of abnormality rate in wild-type and snap25b mutants. The Danio Vision system recorded the swimming behavior of wild-type and snap25b mutants (H) and analysis of total swimming distance (I). Data are presented as mean ± SD, n = 3 or n = 15–18; ** p < 0.01

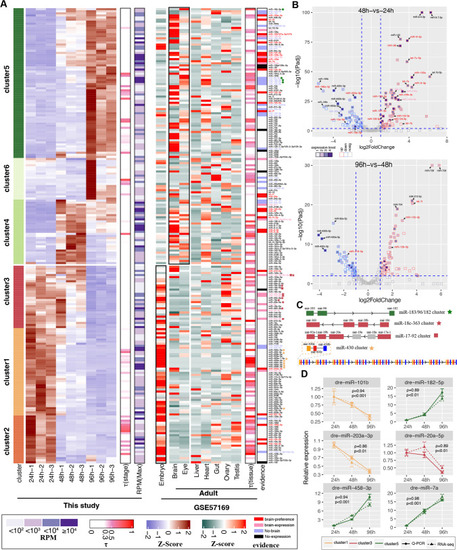
Development-related miRNAs in zebrafish brain. A Expression patterns of differentially expressed miRNAs by pairwise comparisons, expression of miRNAs in adult tissues, as well as the evidence supported by the RNA in situ hybridization experiment. B Volcano plots depict differentially expressed miRNAs in comparison of 48 h vs. 24 h and 96 h vs. 48 h. C Illustration locus of four miRNA clusters. Colors in upper three clusters indicated the expression patterns in Fig. 3a, and gray color indicated miRNAs without differential expression. D RT-qPCR validation of six miRNAs in RNA-seq datasets

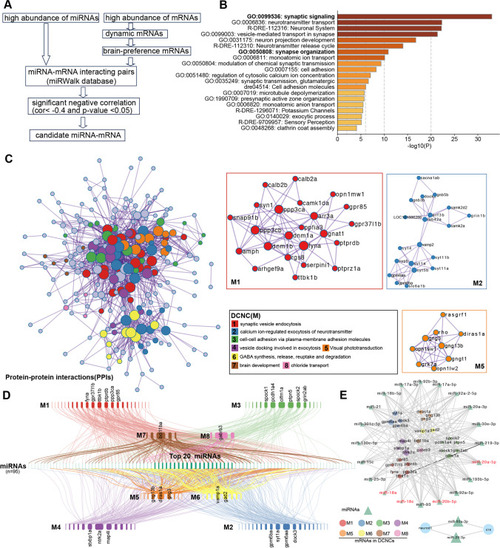
Potential miRNA-mRNA interacted pairs involved in nervous system development. A The workflow of screening miRNA-mRNA interacted pairs. B Functional enrichment analysis of predicted miRNA targets. C Protein–protein interaction network and densely connected network components (DCNCs). D Potential miRNA regulated genes in DCNCs (M1–M8) visualized with a “synteny”-like plot. Link colors and rectangle colors in up- or down-panel depict DCNC colors in panel C. Highly connected genes in each DCNC were labeled. E Visualization of miRNA-mRNA pairs of the top 20 connected miRNAs and highly connected genes in each DCNC and common miRNAs in regulating two key retinal differential transcription factors, crx and neurod1

Acknowledgments
This image is the copyrighted work of the attributed author or publisher, and ZFIN has permission only to display this image to its users. Additional permissions should be obtained from the applicable author or publisher of the image. Full text @ Mol. Neurobiol.