
FIGURE
Fig. 1
- ID
- ZDB-FIG-250130-56
- Publication
- Zhang et al., 2024 - Integrative mRNA and miRNA Expression Profiles from Developing Zebrafish Head Highlight Brain-Preference Genes and Regulatory Networks
- Other Figures
- All Figure Page
- Back to All Figure Page
Fig. 1
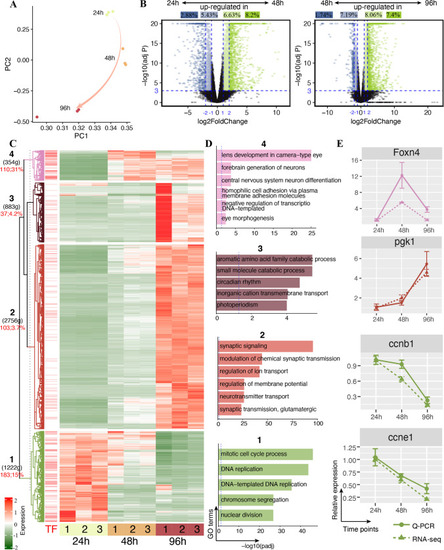
Differentially expressed protein-coding genes (DEGs) in developing zebrafish head transcriptome. |
Expression Data
Expression Detail
Antibody Labeling
Phenotype Data
Phenotype Detail
Acknowledgments
This image is the copyrighted work of the attributed author or publisher, and
ZFIN has permission only to display this image to its users.
Additional permissions should be obtained from the applicable author or publisher of the image.
Full text @ Mol. Neurobiol.