FIGURE SUMMARY
Title

Single-cell chromatin profiling reveals genetic programs activating proregenerative states in nonmyocyte cells

Authors
Dong, Y., Yang, Y., Wang, H., Feng, D., Nist, E., Yapundich, N., Spurlock, B., Craft, M., Qian, L., Liu, J.
Source
Full text @ Sci Adv

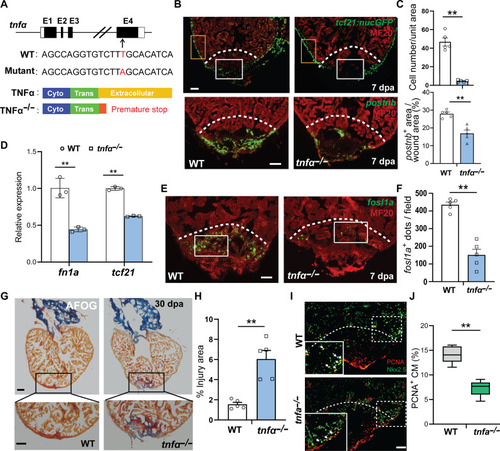
Loss of TNFα function comprises nonCM activation and heart regeneration.

(A) Schematic of zebrafish tnfα gene, with a T-to-A substitution, which creates a premature stop truncating the protein right at the N terminus of its THD domain. (B) Immunohistochemistry for MF20 and GFP on 7-dpa sections from tcf21:nucGFP transgenic fish hearts (upper panel). Lower panels represent RNAscope in situ hybridization for postnb combined with immunostaining for MF20. White boxes represent the injury area, while orange boxes mark the peripheral area. Scale bar, 50 μm. (C) Quantification of the number of tcf21:nucGFP-positive cells and the area of postnb expression in the wound on sections shown in (B). n = 5. (D) Expression of fn1a and tcf21 in 7-dpa hearts determined by quantitative reverse transcription polymerase chain reaction. (E) RNAscope in situ hybridization for aEC marker fosl1a combined with immunohistochemistry for MF20 in the hearts. Scale bar, 50 μm. (F) Quantification of the number of fosl1a-positive dots in the white boxed areas in (E). n = 5. (G) AFOG staining of ventricles at 30 dpa to identify scar (blue) and fibrin (red). Black boxes indicate the injury areas. Scale bar, 100 μm. (H) Quantification of scar area at 30 dpa. n = 5. (I) Immunohistochemistry for PCNA and Nkx2.5 on 7-dpa sections. The white boxed regions are shown in zoom-in images. White arrows indicate PCNA/Nkx2.5 double-positive nuclei. Scale bar, 50 μm. (J) Quantification of PCNA-positive proliferating Nkx2.5-positive myocardial cells at 7 dpa. n = 5. White dashed lines indicate approximate resection plane. P value calculated with two-tailed Student’s t test. **P < 0.01.

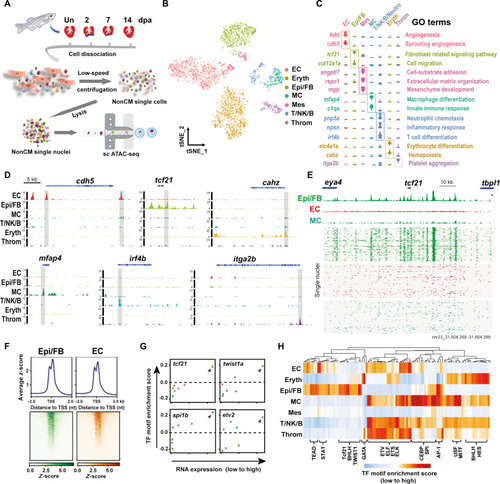
scATAC-seq reveals chromatin accessibility landscape of cardiac nonCMs.

(A) Experimental workflow of nonCM isolation from zebrafish hearts and scATAC-seq (10x Genomics). (B) Cardiac nonCM visualized on tSNE and colored by cell types from scATAC-seq. MC, macrophages; Mes, resident mesenchymal cells; T/NK/B, T/NK/B cells; Neutro, neutrophils; Eryth, erythrocytes; Throm, thrombocytes. (C) Violin plots showing chromatin accessibility of canonical markers for each cell type. GO analysis of these genes in each nonCM cell type. (D) Genomic tracks showing the open chromatin status for the representative gene for individual nonCM cell type. (E) Aggregate ATAC-seq profile (top) and single-nucleus ATAC-seq profile (bottom) of different cell populations around the tcf21 locus. Reads are plotted to represent the single-nucleus profile. (F) Heatmap representing the density of Epi/FB- or EC-specific OCRs in a 4-kb window centered at protein-coding TSS [assembly GRCZ11]. (G) X-Y plots showing the RNA expression levels (x axis) and the TF motif enrichment z-scores (mean values) (y axis) for the transcription factors. Each plot represents one factor, and each dot corresponds to its values for a specific cell type. RNA expression values are captured from the integrative scRNA-seq data of our previous study (7). Dashed horizontal line stands for the neutral value of TF motif enrichment. (H) Heatmap showing the normalized mean TF motif enrichment for nonCM cell types. Rows correspond to cell types and columns denote different TF motifs.

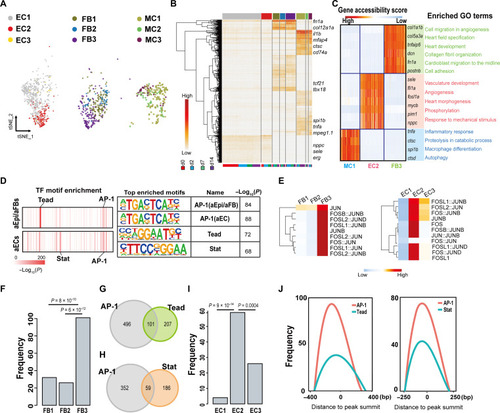
Epi/FBs and ECs show distinct epigenetic features during heart regeneration.

(A) tSNE plot colored by EC (ATAC_EC1-3, abbreviated as EC1-3), Epi/FB (ATAC_Epi/FB1-3, abbreviated as FB1-3), and MC (ATAC_MC1-3, abbreviated as MC1-3) subtypes. (B) Hierarchical (TF motifs) and k-means (cells) clustering of accessibility deviation z-scores across single cells (columns) at different time points of 487 most variable TF motifs (rows). Colors correspond to subpopulations defined in (A). (C) Gene accessibility score for the three transiently activated subtype marker genes, and the enriched GO terms associated with indicated subtypes. (D) Top list of TF motif enrichment for Epi/FB3 and EC2 OCRs, respectively. (E) Heatmap showing enrichment of AP-1 binding motifs in each subpopulation of Epi/FB or EC, respectively. (F to I) Peaks number containing both AP-1 and Tead motif pairs in the differentially accessible regions (DARs) of Epi/FB subpopulations [(F) and (G)] or containing both AP-1 and Stat motif pairs in the DARs of EC subpopulations [(H) and (I)]. P value calculated by Fisher’s exact test. (J) Genomic co-occupancy of AP-1 and Tead around the peak summit in aEpi/aFBs (left) and AP-1 and Stat in aECs (right).

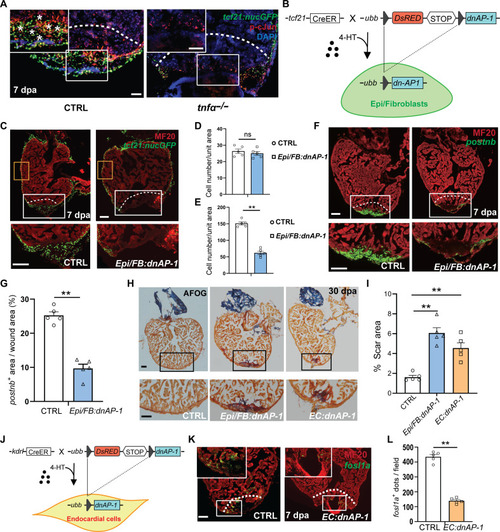
Inhibition of AP-1 activity compromises heart regeneration.

(A) Anti-phospho-c-Jun antibody staining of regenerating hearts from control and tnfα mutant fish carrying tcf21:nucGFP at 7 dpa. Dotted lines and asterisks indicate injury border and colabeled cells, respectively. Scale bar, 50 μm. (B) Schematic of Epi/FB-specific inhibition of AP-1 activity. (C) Representative image of hearts from 7-dpa control and Epi/FB:dnAP-1 hearts carrying tcf21:nucGFP, respectively. Orange boxes mark the peripheral area, and the white boxes mark the injury area, under which are their respective zoom-in images. Scale bar, 50 μm. (D and E), Quantification of the number of tcf21:nucGFP-positive cells in the peripheral and injury area, respectively. n = 5. (F) Concurrent RNAscope in situ hybridization for postnb and immunostaining for MF20 in the 7-dpa control and Epi/FB:dnAP-1 hearts. White boxes mark the injury area, under which are their respective zoom-in images. Scale bar, 50 μm. (G) Quantification of the postnb+ area in the wound on sections. n = 5. (H) Heart sections are stained with AFOG at 30 dpa. Black boxes mark the injury area. Scale bar, 100 μm. (I) Quantification of scar area at 30 dpa. n = 5. (J) Schematic of EC-specific inhibition of AP-1 activity. (K) Concurrent RNAscope in situ hybridization for fosl1a and immunostaining for MF20 in the 7-dpa hearts. Scale bar, 50 μm. (L) Quantification of the number of fosl1a-positive dots in the white boxed area between EC:dnAP-1 and control hearts. n = 5. White dotted lines indicate approximate injury border. P value calculated with two-tailed Student’s t test. **P < 0.01. *P < 0.05.

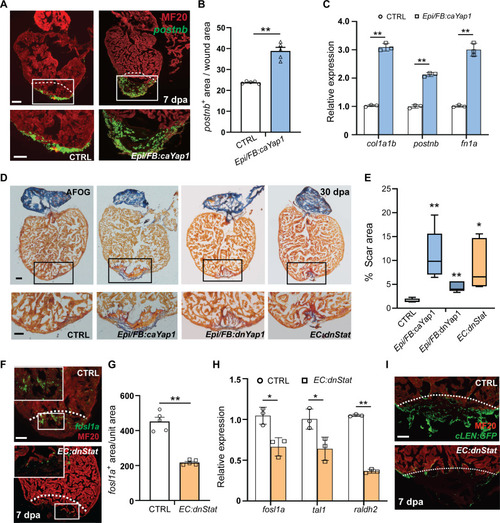
Yap1/Tead activation and inhibition of Stat activity compromises heart regeneration.

(A) Concurrent RNAscope in situ hybridization for postnb and immunostaining for MF20 in the 7-dpa control and Epi/FB:caYap1 hearts. White boxes mark the injury area, under which are their respective zoom-in images. White dashed lines indicate approximate injury border. Scale bar, 50 μm. (B) Quantification of the area of postnb expression in the wound area on sections comparing Epi/FB:caYap1 and control fish. n = 5 hearts. (C) qRT-PCR analysis of col1a1b, postnb, and fn1a in Epi/FB:caYap1 hearts and control hearts at 7 dpa, respectively. (D) AFOG staining for controls, Epi/FB:caYap1, Epi/FB:dnYap1, and EC:dnStat fish hearts at 30 dpa, respectively. Black boxes mark the injury area. Scale bar, 100 μm. (E) Quantification of scar area at 30 dpa. n = 5 hearts. (F) Concurrent RNAscope in situ hybridization for fosl1a and immunostaining for MF20 in the 7-dpa control and EC:dnStat hearts. White dashed lines indicate the approximate resection plane. Scale bar, 50 μm. (G) Quantification of the fosl1a-positive area in the white boxed area comparing control and EC:dnStat fish. n = 5 hearts. (H) qRT-PCR analysis of fosl1a, tal1, and raldh2 in EC:dnStat transgenic fish and controls at 7 dpa, respectively. (I) Images of sections of 7-dpa hearts from transgenic fish carrying cLEN fragments. Scale bar, 50 μm. P value calculated with two-tailed Student’s t test. *P < 0.05. **P < 0.01.

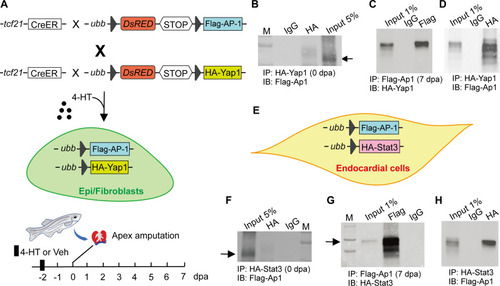
AP-1 interacts with Yap1 and Stat3 in Epi/FBs and ECs, respectively.

(A) Schematic of 4-HT–induced Epi/FB-specific expression of tagged AP-1 and Yap1. The hearts were harvested at 0 and 7 dpa for Co-IP, respectively. (B) Co-IP using uninjured ventricles of the triple transgenic line TgBAC(tcf21:Cre-ERT2); Tg(ubb:loxp-dsRed-loxp-Flag-AP-1); Tg(ubb:loxp-dsRed-loxp-HA-Yap1). Yap1 was immunoprecipitated with anti-HA antibody, and AP-1 was detected by anti-FLAG antibody. A control IgG was used as the negative control for immunoprecipitation. (C and D) Reciprocal Co-IP of AP-1 and Yap1 in Epi/FBs at 7 dpa. IgG was used as the negative control. (E) Schematic of 4-HT–induced EC-specific expression of tagged AP-1 and Stat3. (F) Co-IP of AP-1 and Stat3 in ECs under uninjured conditions. (G and H) Reciprocal Co-IP of AP-1 and Stat3 in ECs during heart regeneration. AP-1 was immunoprecipitated/detected by anti-FLAG antibody, and Stat3 was detected/immunoprecipitated with anti-HA antibody. Control IgG was used as the negative control for immunoprecipitation.

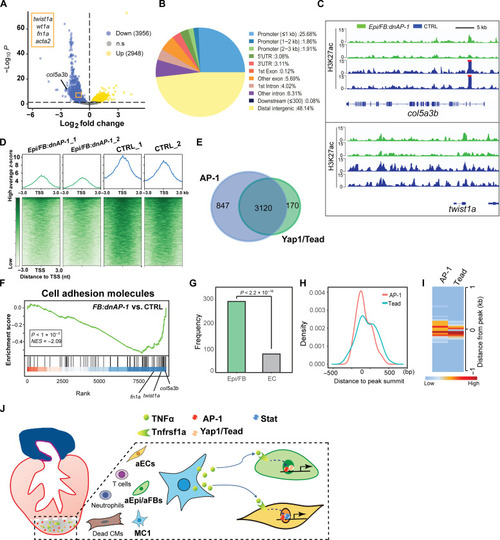
CUT&Tag profiling of H3K27ac reveals nonCM chromatin landscape changes of upon Epi/FB-specific AP-1 inhibition.

(A) Volcano plot illustrating the H3K27ac signal changes in Epi/FB:dnAP-1 hearts compared to controls at 7 dpa. Blue points are less accessible in Epi/FB:dnAP-1 and yellow points are more accessible in Epi/FB:dnAP-1 (fold change ≥0.2, padj ≤0.05). P values were calculated using the Wald significance test and adjusted for multiple testing. Color intensity represents density of points in the volcano plot. ns, no significance. (B) Pie chart depicting differentially regulated H3K27ac peaks distribution at different genome loci as detected by CUT&Tag. (C) A snapshot of the H3K27ac landscape for representative col5a3b and twist1a loci in Epi/FB:dnAP-1 and controls. (D) Histogram and heatmap showing H3K27ac signals in Epi/FB:dnAP-1 and controls at TSSs, respectively. (E) Venn diagram depicting the number and overlap of AP-1 and Tead/Yap1 binding peaks reduced in Epi/FB:dnAP-1 hearts. (F) Gene set enrichment analysis enrichment plots of differentially regulated peaks associated with genes encoding cell adhesion molecules linked with deficiency of AP-1 binding. The barcode plot indicates the position of the genes rank-sorted by relevance, with red and blue colors indicating more or reduced in the Epi/FB:dnAP-1 fish hearts. Some representative genes are marked. (G) Frequency of shared peaks in down-regulated H3K27ac signals collected from CUT&Tag assay and Epi/FB-specific (green) or EC-specific (gray) OCRs captured from scATAC-seq. P value calculated by Fisher’s exact test. (H) Genomic co-occupancy of AP-1 and Tead around the peak summit adopted from peaks (green) in (G). (I) Clustered heatmaps of densities for shared H3K27ac peaks (green) at AP-1 or Tead binding sites. (J) Schematic model showing proinflammatory MC–derived TNFα signaling induces the emergence of transient functional cell states through the cooperative interaction of its downstream transcription factor complex AP-1 with discrete transcription factors in the respective cell types.

Acknowledgments
This image is the copyrighted work of the attributed author or publisher, and ZFIN has permission only to display this image to its users. Additional permissions should be obtained from the applicable author or publisher of the image. Full text @ Sci Adv