IMAGE

Fig. 2.

ID
ZDB-IMAGE-240224-5
Source
Figures for Dong et al., 2024
Image
Figure Caption

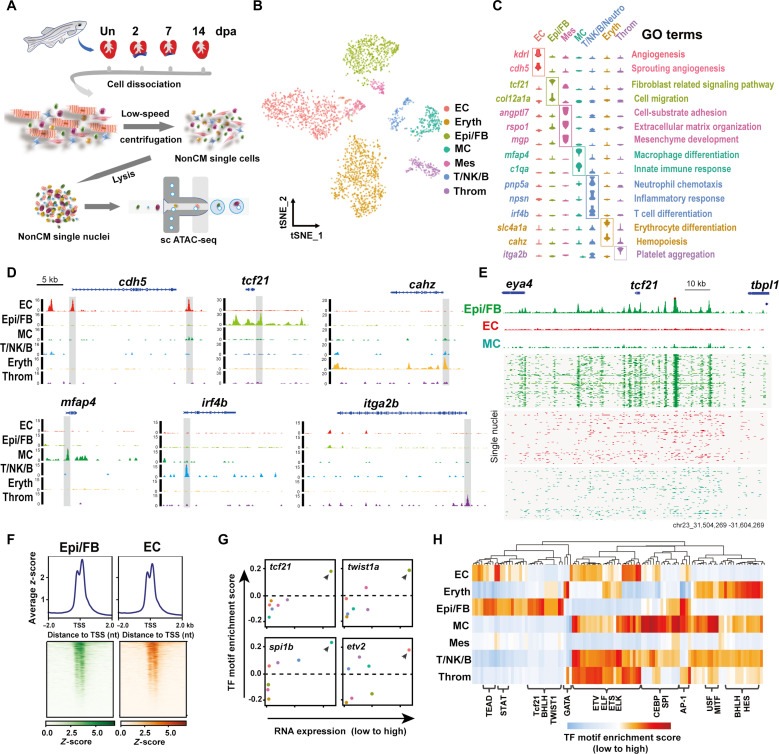
Fig. 2. scATAC-seq reveals chromatin accessibility landscape of cardiac nonCMs.

(A) Experimental workflow of nonCM isolation from zebrafish hearts and scATAC-seq (10x Genomics). (B) Cardiac nonCM visualized on tSNE and colored by cell types from scATAC-seq. MC, macrophages; Mes, resident mesenchymal cells; T/NK/B, T/NK/B cells; Neutro, neutrophils; Eryth, erythrocytes; Throm, thrombocytes. (C) Violin plots showing chromatin accessibility of canonical markers for each cell type. GO analysis of these genes in each nonCM cell type. (D) Genomic tracks showing the open chromatin status for the representative gene for individual nonCM cell type. (E) Aggregate ATAC-seq profile (top) and single-nucleus ATAC-seq profile (bottom) of different cell populations around the tcf21 locus. Reads are plotted to represent the single-nucleus profile. (F) Heatmap representing the density of Epi/FB- or EC-specific OCRs in a 4-kb window centered at protein-coding TSS [assembly GRCZ11]. (G) X-Y plots showing the RNA expression levels (x axis) and the TF motif enrichment z-scores (mean values) (y axis) for the transcription factors. Each plot represents one factor, and each dot corresponds to its values for a specific cell type. RNA expression values are captured from the integrative scRNA-seq data of our previous study (7). Dashed horizontal line stands for the neutral value of TF motif enrichment. (H) Heatmap showing the normalized mean TF motif enrichment for nonCM cell types. Rows correspond to cell types and columns denote different TF motifs.

Acknowledgments
This image is the copyrighted work of the attributed author or publisher, and ZFIN has permission only to display this image to its users. Additional permissions should be obtained from the applicable author or publisher of the image. Full text @ Sci Adv