IMAGE

Fig. 7.

ID
ZDB-IMAGE-240224-13
Source
Figures for Dong et al., 2024
Image
Figure Caption

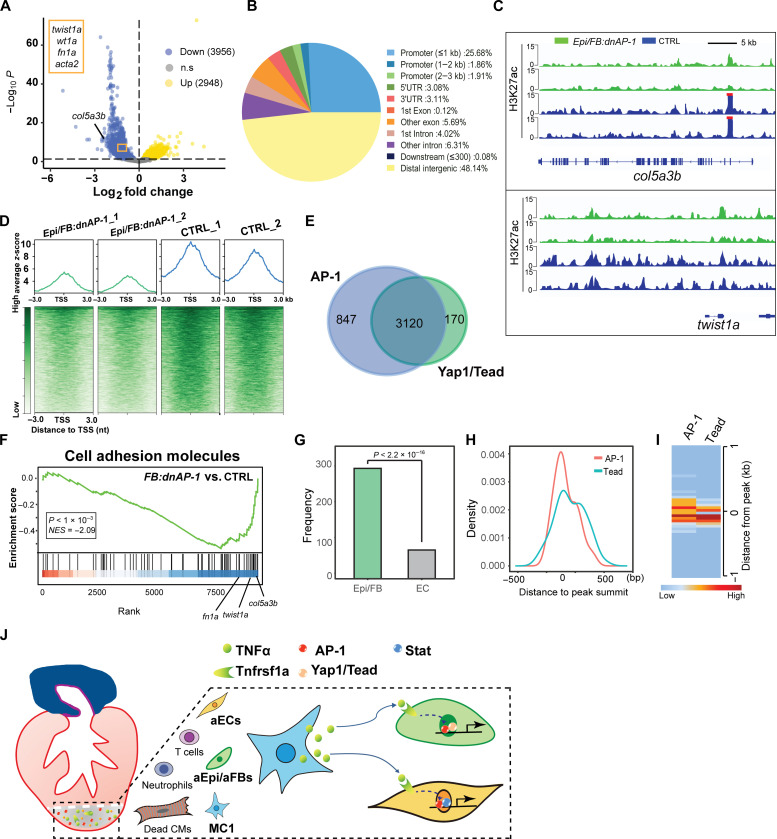
Fig. 7. CUT&Tag profiling of H3K27ac reveals nonCM chromatin landscape changes of upon Epi/FB-specific AP-1 inhibition.

(A) Volcano plot illustrating the H3K27ac signal changes in Epi/FB:dnAP-1 hearts compared to controls at 7 dpa. Blue points are less accessible in Epi/FB:dnAP-1 and yellow points are more accessible in Epi/FB:dnAP-1 (fold change ≥0.2, padj ≤0.05). P values were calculated using the Wald significance test and adjusted for multiple testing. Color intensity represents density of points in the volcano plot. ns, no significance. (B) Pie chart depicting differentially regulated H3K27ac peaks distribution at different genome loci as detected by CUT&Tag. (C) A snapshot of the H3K27ac landscape for representative col5a3b and twist1a loci in Epi/FB:dnAP-1 and controls. (D) Histogram and heatmap showing H3K27ac signals in Epi/FB:dnAP-1 and controls at TSSs, respectively. (E) Venn diagram depicting the number and overlap of AP-1 and Tead/Yap1 binding peaks reduced in Epi/FB:dnAP-1 hearts. (F) Gene set enrichment analysis enrichment plots of differentially regulated peaks associated with genes encoding cell adhesion molecules linked with deficiency of AP-1 binding. The barcode plot indicates the position of the genes rank-sorted by relevance, with red and blue colors indicating more or reduced in the Epi/FB:dnAP-1 fish hearts. Some representative genes are marked. (G) Frequency of shared peaks in down-regulated H3K27ac signals collected from CUT&Tag assay and Epi/FB-specific (green) or EC-specific (gray) OCRs captured from scATAC-seq. P value calculated by Fisher’s exact test. (H) Genomic co-occupancy of AP-1 and Tead around the peak summit adopted from peaks (green) in (G). (I) Clustered heatmaps of densities for shared H3K27ac peaks (green) at AP-1 or Tead binding sites. (J) Schematic model showing proinflammatory MC–derived TNFα signaling induces the emergence of transient functional cell states through the cooperative interaction of its downstream transcription factor complex AP-1 with discrete transcription factors in the respective cell types.

Acknowledgments
This image is the copyrighted work of the attributed author or publisher, and ZFIN has permission only to display this image to its users. Additional permissions should be obtained from the applicable author or publisher of the image. Full text @ Sci Adv