IMAGE

Fig. 5.

ID
ZDB-IMAGE-240224-8
Source
Figures for Dong et al., 2024
Image
Figure Caption

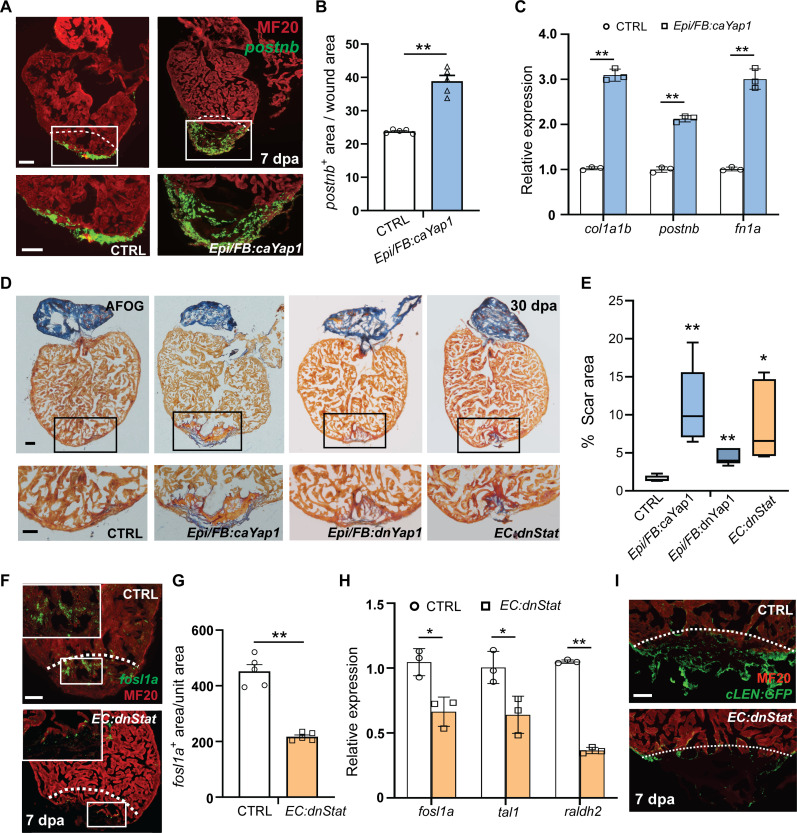
Fig. 5. Yap1/Tead activation and inhibition of Stat activity compromises heart regeneration.

(A) Concurrent RNAscope in situ hybridization for postnb and immunostaining for MF20 in the 7-dpa control and Epi/FB:caYap1 hearts. White boxes mark the injury area, under which are their respective zoom-in images. White dashed lines indicate approximate injury border. Scale bar, 50 μm. (B) Quantification of the area of postnb expression in the wound area on sections comparing Epi/FB:caYap1 and control fish. n = 5 hearts. (C) qRT-PCR analysis of col1a1b, postnb, and fn1a in Epi/FB:caYap1 hearts and control hearts at 7 dpa, respectively. (D) AFOG staining for controls, Epi/FB:caYap1, Epi/FB:dnYap1, and EC:dnStat fish hearts at 30 dpa, respectively. Black boxes mark the injury area. Scale bar, 100 μm. (E) Quantification of scar area at 30 dpa. n = 5 hearts. (F) Concurrent RNAscope in situ hybridization for fosl1a and immunostaining for MF20 in the 7-dpa control and EC:dnStat hearts. White dashed lines indicate the approximate resection plane. Scale bar, 50 μm. (G) Quantification of the fosl1a-positive area in the white boxed area comparing control and EC:dnStat fish. n = 5 hearts. (H) qRT-PCR analysis of fosl1a, tal1, and raldh2 in EC:dnStat transgenic fish and controls at 7 dpa, respectively. (I) Images of sections of 7-dpa hearts from transgenic fish carrying cLEN fragments. Scale bar, 50 μm. P value calculated with two-tailed Student’s t test. *P < 0.05. **P < 0.01.

Acknowledgments
This image is the copyrighted work of the attributed author or publisher, and ZFIN has permission only to display this image to its users. Additional permissions should be obtained from the applicable author or publisher of the image. Full text @ Sci Adv