|
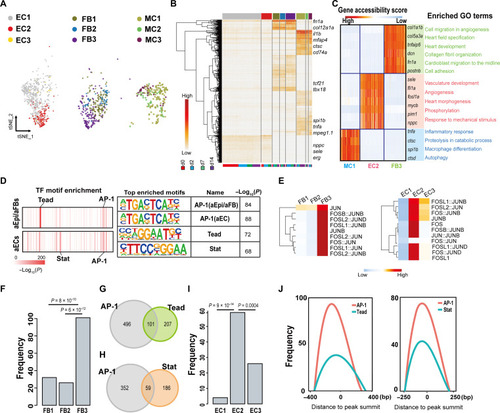
Epi/FBs and ECs show distinct epigenetic features during heart regeneration. (A) tSNE plot colored by EC (ATAC_EC1-3, abbreviated as EC1-3), Epi/FB (ATAC_Epi/FB1-3, abbreviated as FB1-3), and MC (ATAC_MC1-3, abbreviated as MC1-3) subtypes. (B) Hierarchical (TF motifs) and k-means (cells) clustering of accessibility deviation z-scores across single cells (columns) at different time points of 487 most variable TF motifs (rows). Colors correspond to subpopulations defined in (A). (C) Gene accessibility score for the three transiently activated subtype marker genes, and the enriched GO terms associated with indicated subtypes. (D) Top list of TF motif enrichment for Epi/FB3 and EC2 OCRs, respectively. (E) Heatmap showing enrichment of AP-1 binding motifs in each subpopulation of Epi/FB or EC, respectively. (F to I) Peaks number containing both AP-1 and Tead motif pairs in the differentially accessible regions (DARs) of Epi/FB subpopulations [(F) and (G)] or containing both AP-1 and Stat motif pairs in the DARs of EC subpopulations [(H) and (I)]. P value calculated by Fisher’s exact test. (J) Genomic co-occupancy of AP-1 and Tead around the peak summit in aEpi/aFBs (left) and AP-1 and Stat in aECs (right).
|