
- Title
-
Genetic variant classification by predicted protein structure: A case study on IRF6
- Authors
- Murali, H., Wang, P., Liao, E.C., Wang, K.
- Source
- Full text @ Comput Struct Biotechnol J
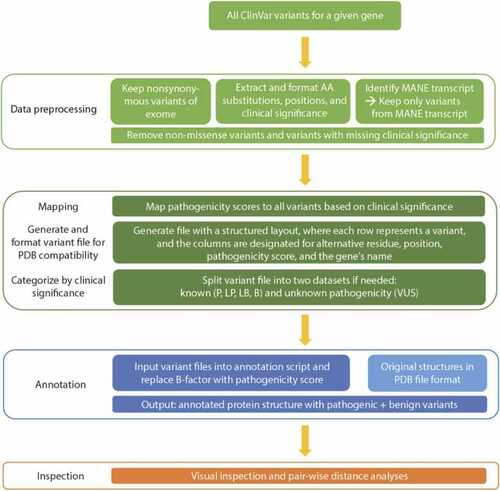
Overview of the workflow for variant annotation of protein structures. All ClinVar variants must first undergo data preprocessing and parsing steps to ensure that only nonsynonymous variants within the relevant transcript that also have data about clinical significance move on to the next steps. The clinical significance categories (P, LP, VUS, LB, B) are assigned a pathogenicity score (see Methods), which is then used to map variants onto the protein structure for further visualization, inspection, and analysis. The other ClinVar class of variants with “conflicting interpretations” is omitted from analysis. |
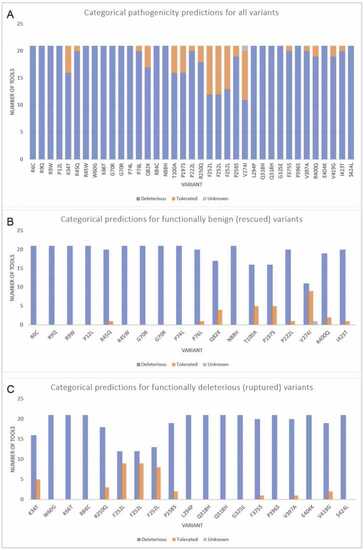
Pathogenicity predictions of IRF6 variants from categorical tools (A) This graph shows the distribution of predictions for each variant from tools that give a categorical prediction (ex. deleterious or benign). Based on these results, computational tools are more likely to predict variants to be deleterious. Interestingly, the nucleotide variants that resulted in an amino acid change in F252 showed varying results, even though all 3 variants result in the same amino acid change. One tool (M-CAP) did not provide a prediction for V274I and is thus marked as unknown. Out of the 37 variants, 19 variants were unanimously predicted to be deleterious by all computational tools. Graphs B and C depict the breakdown of predicted clinical significance from categorical computational tools for (B) variants that ‘rescued’ the irf6 -/- zebrafish (benign) and (C) variants that remained as ‘ruptured’ (deleterious). |
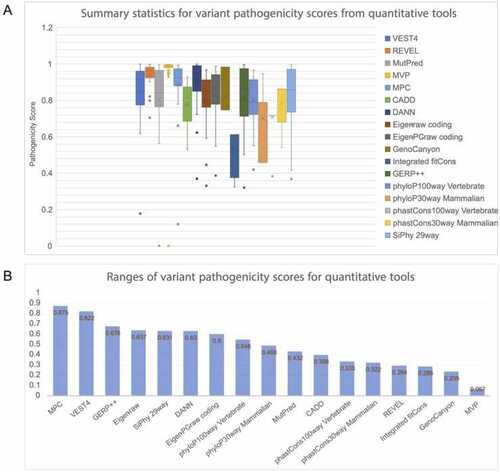
Summary statistics of scores generated by quantitative tools for IRF6 variants (A) Panel A shows summary statistics, such as the median and interquartile range, for the scores generated by each of the quantitative pathogenicity prediction tools for the selected set of IRF6 variants. Each tool outputs a score from 0 to 1, where 1 indicates higher pathogenicity. None of the tools scored any variant as fully benign (0.00) and the data points at 0 correspond to unavailable scores for variant V274I from MVP and from MutPred. (B) Panel B shows the ranges in numerical scores for each tool. MPC and VEST4 have the largest distribution of scores when including outliers, while MVP has the smallest range. Furthermore, MVP scored almost all variants as highly pathogenic. |
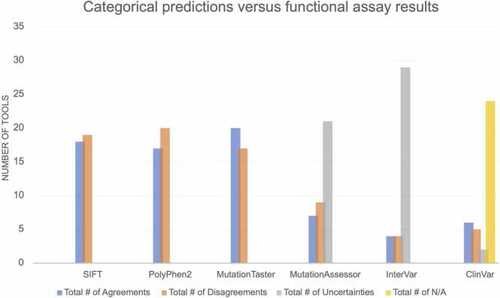
Pathogenicity result comparison between Functional Assay and 6 Tools for IRF6 variants. For each of these categorical tools, approximately 50% of the variants have discordant results between experimental results and computational predictions. Notably, even ClinVar annotations show a discrepancy with experimental results, although many variants were not present in ClinVar. |
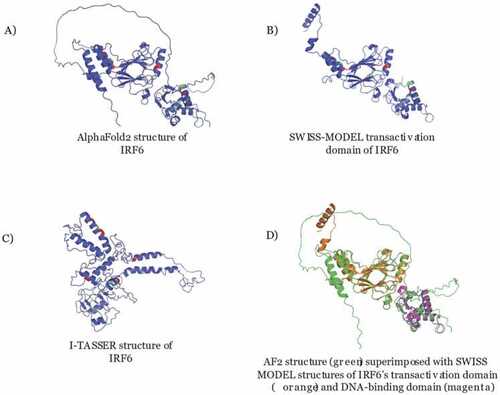
Predicted Protein Structures from different programs These images show (A) the AlphaFold2 structure prediction of IRF6 (residues 1–467), (B) the SWISS-MODEL structure prediction of the transactivation domain of IRF6 (residues 214–445), and (C) the I-TASSER structure prediction of IRF6 (residues 1–467) of highest confidence. Green residues were benign and red residues were pathogenic according to functional analysis. (D) The two SWISS-MODEL structures of the IRF6 transactivation and DNA-binding domains (residues 9–122) were superimposed onto the AlphaFold2 predicted structure. |
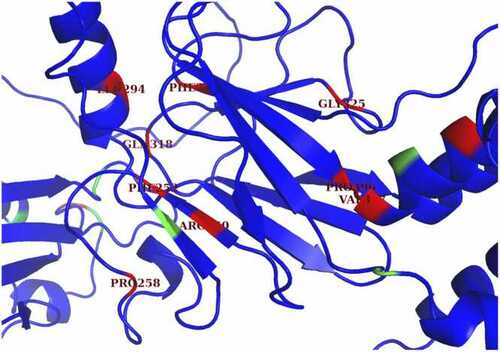
Potential visible binding pocket in protein-binding domain. This image shows a zoomed-in version of the AlphaFold2 structure of full IRF6. Some of the residues in or near the beta sheet, which is mainly part of the protein-binding domain, were categorized as ruptured. Although some of these residues are distant from each other in the amino acid sequence, there are some pairs that are close together in the 3D folded structure, such as ARG-250 and PHE-375. The clustering of red mutations in the protein-binding domain highlights the significance of this domain for IRF6 protein function and provide insight on which proteins may be more likely to be deleterious. |
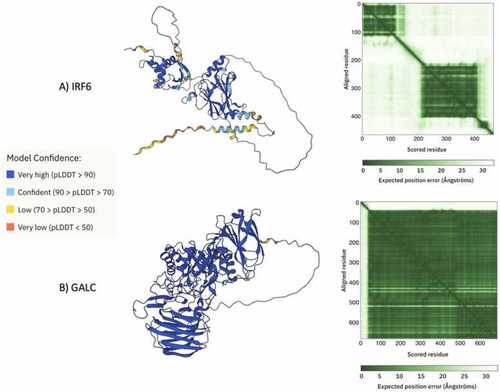
A) Image of the AlphaFold2 prediction for IRF6, color coded by confidence score and the Predicted Aligned Error (PAE) from AlphaFold2 database. The color at position (x, y) indicates AlphaFold2’s expected position error at residue x, when the predicted and true structures are aligned on residue y. The PAE plot is useful for assessing the inter-domain accuracy of the predicted structure. Dark green indicates low error and light green indicates high error. Each of the squares corresponds to a domain. (B) Image of the AlphaFold2 prediction for GALC, color coded by confidence score and the Predicted Aligned Error (PAE) from AlphaFold2 database. These images were sourced directly from AlphaFold2 and the legend was adapted from AlphaFold2. |