
|
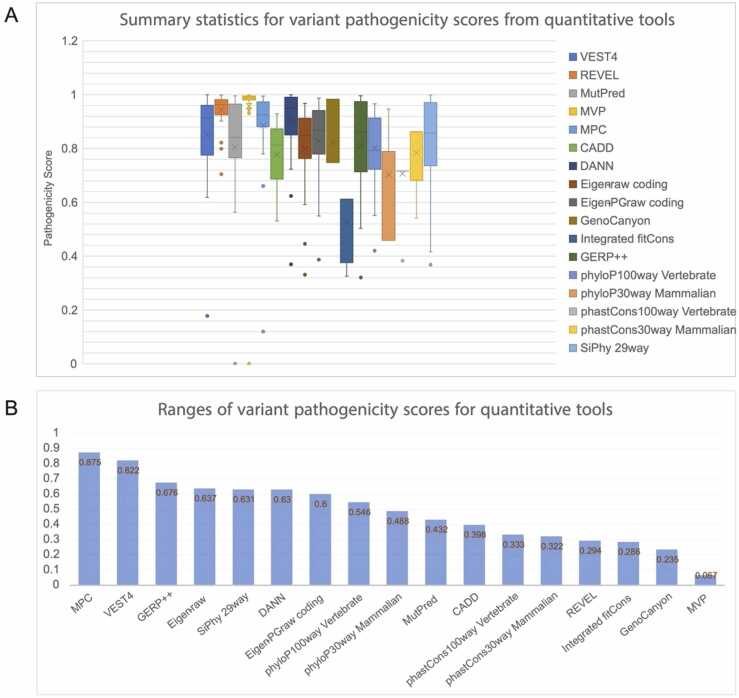
Fig. 3
Summary statistics of scores generated by quantitative tools for IRF6 variants (A) Panel A shows summary statistics, such as the median and interquartile range, for the scores generated by each of the quantitative pathogenicity prediction tools for the selected set of IRF6 variants. Each tool outputs a score from 0 to 1, where 1 indicates higher pathogenicity. None of the tools scored any variant as fully benign (0.00) and the data points at 0 correspond to unavailable scores for variant V274I from MVP and from MutPred. (B) Panel B shows the ranges in numerical scores for each tool. MPC and VEST4 have the largest distribution of scores when including outliers, while MVP has the smallest range. Furthermore, MVP scored almost all variants as highly pathogenic.