
Fig. 7
- ID
- ZDB-FIG-240219-15
- Publication
- Murali et al., 2024 - Genetic variant classification by predicted protein structure: A case study on IRF6
- Other Figures
- All Figure Page
- Back to All Figure Page
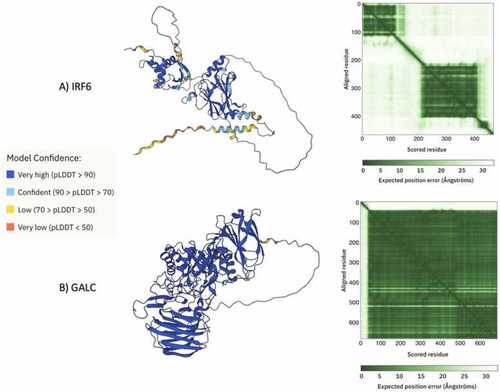
A) Image of the AlphaFold2 prediction for IRF6, color coded by confidence score and the Predicted Aligned Error (PAE) from AlphaFold2 database. The color at position (x, y) indicates AlphaFold2’s expected position error at residue x, when the predicted and true structures are aligned on residue y. The PAE plot is useful for assessing the inter-domain accuracy of the predicted structure. Dark green indicates low error and light green indicates high error. Each of the squares corresponds to a domain. (B) Image of the AlphaFold2 prediction for GALC, color coded by confidence score and the Predicted Aligned Error (PAE) from AlphaFold2 database. These images were sourced directly from AlphaFold2 and the legend was adapted from AlphaFold2. |