
- Title
-
Guarea microcarpa C. DC. extract inhibits NLRP3 inflammasome by suppressing its ATPase activity
- Authors
- Lee, S., Yun, S., Yang, H., Lee, N., Kim, Y., Lee, S., Zamora, N.A., Montero, S.S., Yi, D.K., Kim, S.Y., Choi, S., Choi, T., Kim, M.S., Lee, Y., Park, Y.H.
- Source
- Full text @ J. Ethnopharmacol.

GM specifically inhibits the NLRP3 inflammasome. (A) Schematic outline of the in vitro NLRP3 inflammasome activation experiments. (B, C) J774A.1 cells were treated with GM for 2 h or overnight, respectively. (D) Differentiated THP-1 cells were treated with GM for 2 h, and cell viability was measured. (E, F) LPS-primed J774A.1 cells were treated with GM for 2 h and activated by (E) nigericin (10 μM) for 30 min or (F) MSU (100 μg/mL) for 3 h with or without MCC950. (G) LPS-primed THP-1 cells were treated with GM for 2 h and activated by nigericin (10 μM) for 1 h with or without MCC950. (H) To activate the AIM2 inflammasome, LPS-primed J774A.1 cells were treated with GM for 2 h and transfected with dsDNA (2 μg/mL) for 3 h. (I) To activate the NLRC4 inflammasome, LPS-primed J774A.1 cells were treated with GM for 2 h and transfected with flagellin (1.25 μg/mL) for 3 h. Supernatants and lysate were assessed via immunoblotting. Data are displayed as the means ± SEM. One-way ANOVA with Bonferroni post-hoc tests were used for statistical analyses; *P < 0.05, **P < 0.01, ***P < 0.001, ****P < 0.0001, n.s. not significant. GM, Guarea microcarpa C. DC Extract; LPS, Lipopolysaccharide; IL-1β, interleukin-1beta. |
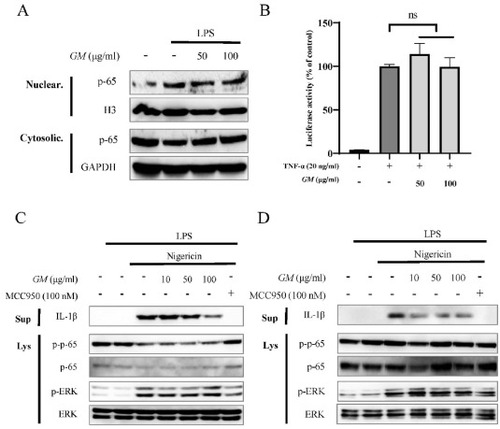
GM does not affect NF-κB signaling. (A) LPS-primed J774A.1 cells were treated with GM for 2 h. NF-κB (p65) translocation was confirmed via immunoblotting. (B) pGL4.32 luciferase reporter vector-transfected 293T cells were stimulated with TNF-α (20 ng/mL) and simultaneously treated with GM for 5 h. The luciferase activity of NF-κB was measured using a Promega Bright-Glo luciferase assay system. (C) LPS-primed J774A.1 cells and (D) LPS-primed THP-1 cells were treated with GM for 2 h and activated with nigericin (10 μM) for 30 min or 1 h, respectively. Supernatants and lysates were assessed via immunoblotting. Data are displayed as the means ± SEM. One-way ANOVA and Bonferroni post-hoc tests were used for statistical analyses; *P < 0.05, **P < 0.01, ***P < 0.001, ****P < 0.0001, n.s. not significant. |
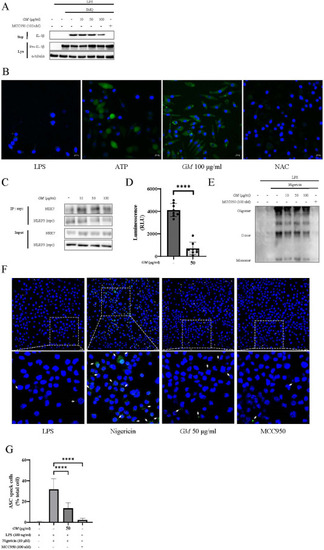
GM suppresses the ATPase activity of NLRP3. (A) LPS-primed J774A.1 cells were treated with GM for 2 h and activated with imiquimod (200 μM) for 1 h. Supernatants and lysates were assessed via immunoblotting. (B) LPS-primed J774A.1 cells were treated with GM or NAC and activated with ATP (5 mM) for 10 min. ROS levels were fluorescently detected with DCF-DA solution (20 μM). (C) NLRP3-myc vector-transfected 293FT cells were treated with GM for 2 h. NEK7-NLRP3 interactions were confirmed using co-immunoprecipitation. (D) NLRP3's ATPase activity under GM treatment was determined via luminescence using an ADP-Glo assay. (E) Pellets of THP-1 cells were cross-linked using DSS (25 mM) and detected via immunoblotting. (F) LPS-primed J774A.1 cells were treated with GM for 2 h and activated with nigericin (10 μM) for 30 min. Representative immunofluorescence images of ASC speck formation were confirmed using a confocal laser-scanning microscope (Carl Zeiss, LSM710). (G) Graph showing the counts of ASC specks. |

Zebrafish embryo model of LPS-induced inflammation. (A) Representative images of posterior portions of zebrafish embryos with Sudan Black B staining at 3 days post-fertilization (dpf). The upper panel indicates the control group, the middle panel indicates the LPS-induced inflammation group (LPS, 10 μg/mL), and the bottom panel indicates the LPS-induced inflammation group treated with dexamethasone (4 μg/mL). The red dotted area indicates the caudal hematopoietic tissue (CHT). (B) Quantification of the number of Sudan Black B-positive neutrophils in the CHT described in (A). The graph represents the means ± SEM. of individual values. P-values were calculated using an unpaired two-tailed Student's t-test. **P < 0.01. (For interpretation of the references to colour in this figure legend, the reader is referred to the Web version of this article.) |
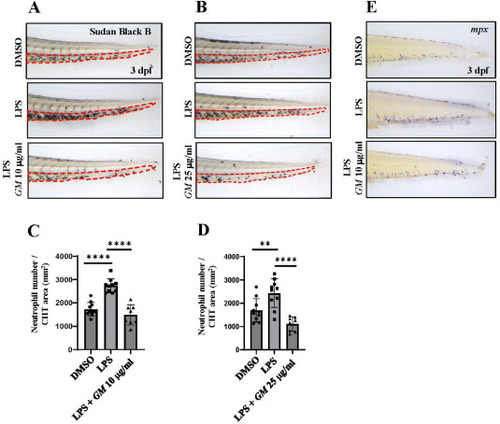
GM alleviates LPS-induced inflammatory response in zebrafish. (A, B) Representative images of zebrafish embryos with Sudan Black B staining at 3 days post-fertilization (dpf). The upper panel indicates the control group with DMSO (A, DMSO 0.0025%; B, DMSO 0.0625%), the middle panel indicates the LPS-induced inflammation group (10 μg/mL), and the bottom panel indicates the LPS-induced inflammation group treated with GM (A, 10 μg/mL and B, 25 μg/mL of GM). The red dotted area indicates the CHT. (C, D) Quantification of the number of Sudan Black B-positive neutrophils in the CHT of zebrafish treated with GM after LPS-induced inflammation (C, 10 μg/mL and D, 25 μg/mL of GM). (E) Representative images of whole-mount in situ hybridization using an mpx probe in the CHT after LPS induction and GM treatment (10 μg/mL) at 3 dpf. All graphs represent the means ± SEM. of individual values. P-values were calculated using an unpaired two-tailed Student's t-test. **P < 0.01; ****P < 0.0001. (For interpretation of the references to colour in this figure legend, the reader is referred to the Web version of this article.) |