
|
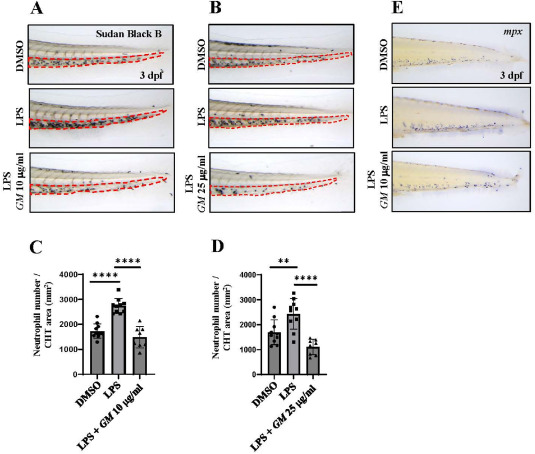
Fig. 5 GM alleviates LPS-induced inflammatory response in zebrafish. (A, B) Representative images of zebrafish embryos with Sudan Black B staining at 3 days post-fertilization (dpf). The upper panel indicates the control group with DMSO (A, DMSO 0.0025%; B, DMSO 0.0625%), the middle panel indicates the LPS-induced inflammation group (10 μg/mL), and the bottom panel indicates the LPS-induced inflammation group treated with GM (A, 10 μg/mL and B, 25 μg/mL of GM). The red dotted area indicates the CHT. (C, D) Quantification of the number of Sudan Black B-positive neutrophils in the CHT of zebrafish treated with GM after LPS-induced inflammation (C, 10 μg/mL and D, 25 μg/mL of GM). (E) Representative images of whole-mount in situ hybridization using an mpx probe in the CHT after LPS induction and GM treatment (10 μg/mL) at 3 dpf. All graphs represent the means ± SEM. of individual values. P-values were calculated using an unpaired two-tailed Student's t-test. **P < 0.01; ****P < 0.0001. (For interpretation of the references to colour in this figure legend, the reader is referred to the Web version of this article.)