
- Title
-
ATP5PO levels regulate enteric nervous system development in zebrafish, linking Hirschsprung disease to Down Syndrome
- Authors
- Kuil, L.E., Chauhan, R.K., de Graaf, B.M., Cheng, W.W., Kakiailatu, N.J.M., Lasabuda, R., Verhaeghe, C., Windster, J.D., Schriemer, D., Azmani, Z., Brooks, A.S., Edie, S., Reeves, R.H., Eggen, B.J.L., Shepherd, I.T., Burns, A.J., Hofstra, R.M.W., Melotte, V., Brosens, E., Alves, M.M.
- Source
- Full text @ BBA Molecular Basis of Disease
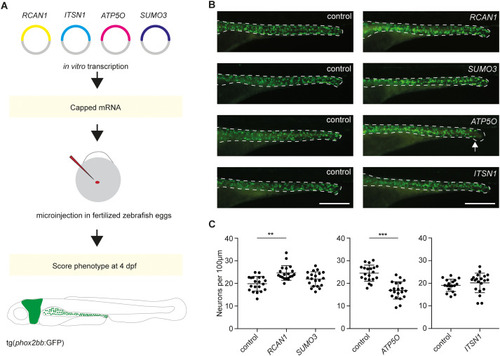
Systematic approach to assess the effects of overexpression of Hsa21 genes on ENS development in zebrafish. A. Schematic representation of the experimental setup. B. Representative images of control and larvae injected with human RNA. The arrow depicts the start of the intestine that lacks ENS cells. Scale bar represents 200 μm. C. Quantification of the number of phox2bb:GFP+ enteric neurons per 100 μm gut length. **p < 0.01, *** = p < 0.001. Each dot represents one animal; error bars represent standard deviation. |
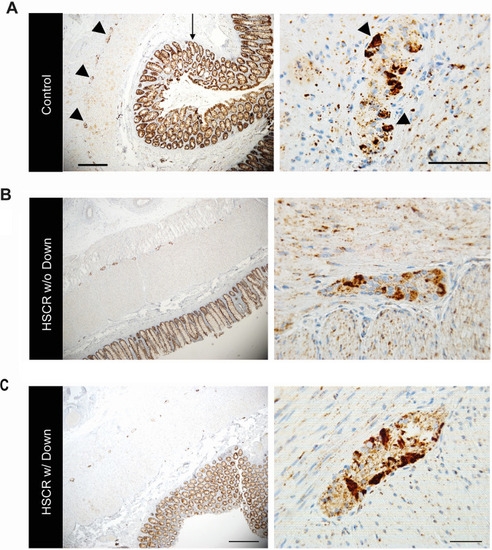
ATP5PO is expressed in the myenteric plexus of the human colon. A. Intestine of a healthy individual showing ATP5PO staining in the myenteric plexus (arrowheads) and the epithelium (arrow). Scale bars represent 100 μm. B. Representative images of the (ganglionic) intestines of a HSCR patient without DS, and C. a HSCR patient with DS. Similar expression patterns of ATP5PO were detected. Scale bars represent 100 μm (left panels) and 50 μm (right panels); n = 3 per group. |
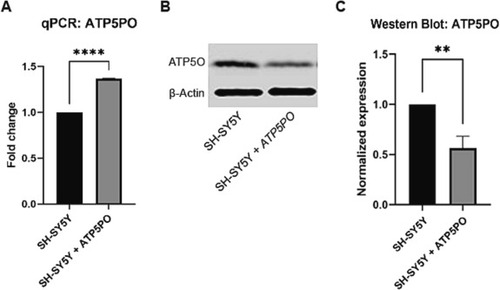
ATP5PO RNA overexpression leads to reduced ATP5PO protein. A. RT-qPCR data showing ATP5PO RNA expression levels in SH-SY5Y and SH-SY5Y-ATP5PO stable cells. Mean of two technical replicates is visualized. Error bar represents standard deviation; *p < 0.05. Experiment was performed in triplicate. B. Representative image of western blot. C. Western blot quantification showing reduced ATP5PO protein expression in SH-SY5Y-ATP5PO cells, normalized to b-actin. Mean of three independent experiments is plotted. Error bar represents standard deviation; **p < 0.01. |
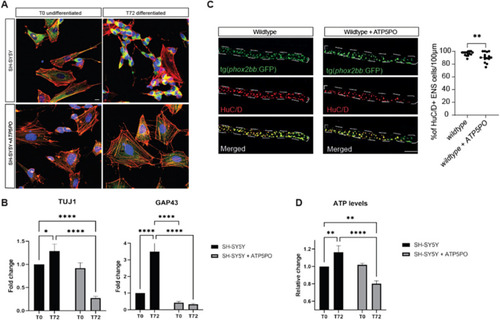
Overexpression of ATP5PO impairs neuronal differentiation and production of ATP levels. A. Representative images of undifferentiated (T0) and differentiated (T72) control SH-SY5Y and SH-SY5Y-ATP5PO cells. Phalloidin in red, TUJ1 in green and DAPI in blue. A differentiated neuronal morphology was only observed in control cells. Moreover, TUJ1 expression was reduced in SH-SY5Y-ATP5PO cells when compared to SH-SY5Y. Scale bar represents 50 μm. B. RT-qPCR data showing increased expression of neuronal markers (TUJ1 and GAP43) in control SH-SY5Y cells 72 h after differentiation, but not in SH-SY5Y-ATP5PO cells. Mean of two technical replicates is visualized. (two-way ANOVA TUJ1: effect of ATP5PO overexpression p < 0.01, effect of differentiation p < 0.05, and interaction effect between genotype and differentiation p < 0.01; GAP43: effect of ATP5PO overexpression p < 0.0001, effect of differentiation p < 0.0001, and interaction effect between genotype and differentiation p < 0.0001) C. HuC/D stainings performed at 4 dpf showed that overexpression of ATP5PO in zebrafish, leads to reduced neuronal differentiation. D. ATP levels in control SH-SY5Y cells increase, as expected, upon induction of differentiation, whereas in SH-SY5Y-ATP5PO cells there is a decrease in ATP levels; **p < 0.01, ****p < 0.0001. A–B and D Average of three independent experiments is visualized. (For interpretation of the references to colour in this figure legend, the reader is referred to the web version of this article.) |
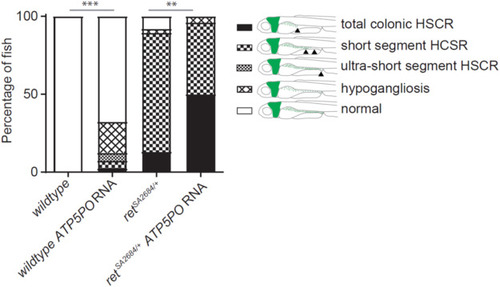
ATP5PO overexpression shows epistasis with RET. Quantification of the percentage of larvae presenting with ENS phenotypes reminiscent of HSCR in the different experimental groups. Due to ATP5PO overexpression in the retSA2684/+ background, more larvae significantly present with a phenotype reminiscent of total colonic HSCR (black bars), compared to retSA2684/+ alone. ***p < 0.001, **p < 0.01. PHENOTYPE:
|

ZFIN is incorporating published figure images and captions as part of an ongoing project. Figures from some publications have not yet been curated, or are not available for display because of copyright restrictions. PHENOTYPE:
|
|
ZFIN is incorporating published figure images and captions as part of an ongoing project. Figures from some publications have not yet been curated, or are not available for display because of copyright restrictions. |
|
ZFIN is incorporating published figure images and captions as part of an ongoing project. Figures from some publications have not yet been curated, or are not available for display because of copyright restrictions. PHENOTYPE:
|
Reprinted from Biochimica et biophysica acta. Molecular basis of disease, 1870(3), Kuil, L.E., Chauhan, R.K., de Graaf, B.M., Cheng, W.W., Kakiailatu, N.J.M., Lasabuda, R., Verhaeghe, C., Windster, J.D., Schriemer, D., Azmani, Z., Brooks, A.S., Edie, S., Reeves, R.H., Eggen, B.J.L., Shepherd, I.T., Burns, A.J., Hofstra, R.M.W., Melotte, V., Brosens, E., Alves, M.M., ATP5PO levels regulate enteric nervous system development in zebrafish, linking Hirschsprung disease to Down Syndrome, 166991, Copyright (2023) with permission from Elsevier. Full text @ BBA Molecular Basis of Disease