
Image
|
Figure Caption
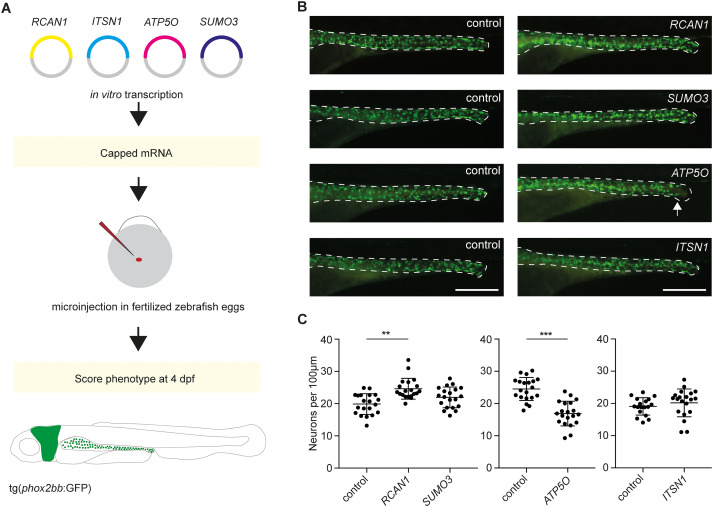
Fig. 1 Systematic approach to assess the effects of overexpression of Hsa21 genes on ENS development in zebrafish. A. Schematic representation of the experimental setup. B. Representative images of control and larvae injected with human RNA. The arrow depicts the start of the intestine that lacks ENS cells. Scale bar represents 200 μm. C. Quantification of the number of phox2bb:GFP+ enteric neurons per 100 μm gut length. **p < 0.01, *** = p < 0.001. Each dot represents one animal; error bars represent standard deviation.
Acknowledgments
This image is the copyrighted work of the attributed author or publisher, and
ZFIN has permission only to display this image to its users.
Additional permissions should be obtained from the applicable author or publisher of the image.
Reprinted from Biochimica et biophysica acta. Molecular basis of disease, 1870(3), Kuil, L.E., Chauhan, R.K., de Graaf, B.M., Cheng, W.W., Kakiailatu, N.J.M., Lasabuda, R., Verhaeghe, C., Windster, J.D., Schriemer, D., Azmani, Z., Brooks, A.S., Edie, S., Reeves, R.H., Eggen, B.J.L., Shepherd, I.T., Burns, A.J., Hofstra, R.M.W., Melotte, V., Brosens, E., Alves, M.M., ATP5PO levels regulate enteric nervous system development in zebrafish, linking Hirschsprung disease to Down Syndrome, 166991, Copyright (2023) with permission from Elsevier. Full text @ BBA Molecular Basis of Disease