
- Title
-
Electrical synapse structure requires distinct isoforms of a postsynaptic scaffold
- Authors
- Michel, J.C., Grivette, M.M.B., Harshfield, A.T., Huynh, L., Komons, A.P., Loomis, B., McKinnis, K., Miller, B.T., Nguyen, E.Q., Huang, T.W., Lauf, S., Michel, E.S., Michel, M.E., Kissinger, J.S., Marsh, A.J., Crow, W.E., Kaye, L.E., Lasseigne, A.M., Lukowicz-Bedford, R.M., Farnsworth, D.R., Martin, E.A., Miller, A.C.
- Source
- Full text @ PLoS Genet.
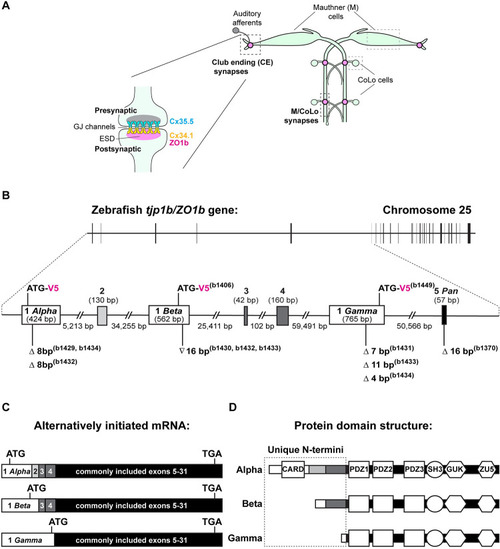
The |
Alternatively initiated isoforms |

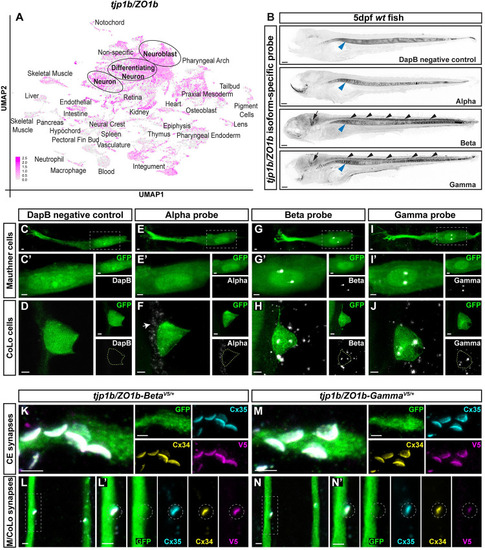
ZO1b-Beta is necessary for robust Connexin localization to electrical synapses. |
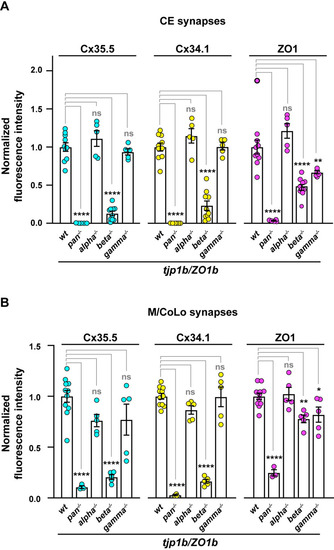
Quantification of ZO1 isoform mutants. |

ZO1b-Beta is sufficient for robust Connexin localization to electrical synapses. |
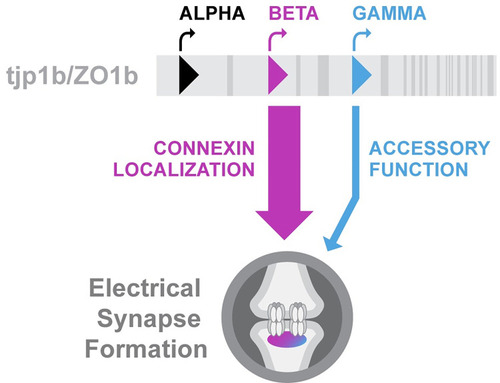
Model of Diagram summarizing the contribution of each ZO1b isoform to electrical synapse formation in the Mauthner circuit. Unique first exons of |