|
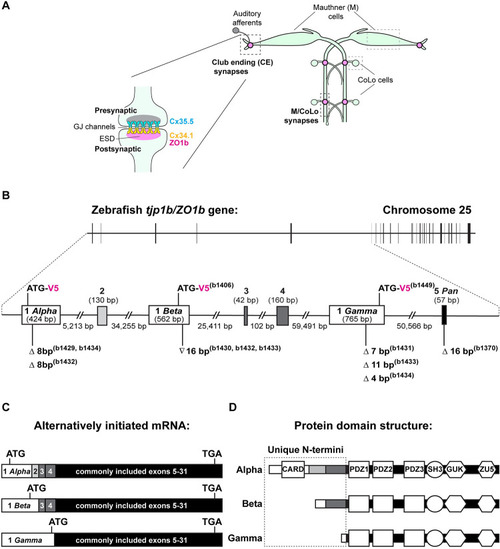
The tjp1b/ZO1b gene is alternatively initiated. A. Cartoon schematic illustrating the electrical synapses of interest in the Mauthner cell circuit. The image represents a dorsal view with anterior on top. Boxed regions in light grey indicate the Mauthner (M) and CoLo cell bodies, as labeled. Boxed regions in dark grey indicate the stereotypical synaptic contacts used for analysis in this study. Presynaptic auditory afferents contact the postsynaptic Mauthner cell lateral dendrite in the hindbrain forming Club Ending (CE) synapses (denoted by pink circles). In the spinal cord, the presynaptic Mauthner axons form en passant electrical synapses with the postsynaptic CoLo interneurons (M/CoLo synapses, denoted by pink circles) in each spinal cord hemisegment (2 of 30 repeating spinal segments are shown). A cartoon enlargement of an electrical synapse in the Mauthner cell circuit appears to the left. Molecularly asymmetric Connexin hemichannels (Cx35.5 [cyan], Cx34.1 [yellow]) directly couple neurons by forming gap junction (GJ) channels. The formation and function of electrical synapses are regulated by ZO1b scaffolds in the electrical synapse density (ESD, magenta). B. Schematic diagram of the tjp1b/ZO1b gene locus on chromosome 25: 32,031,536–32,271,394 (GRCz11 Ensembl) showing the exon structure located on the forward strand. Horizontal black bar represents the DNA strand and vertical black bars represent individual exons. The region containing alternatively initiated exons for tjp1b/ZO1b-Alpha, -Beta, and -Gamma isoforms is expanded between the dashed lines (Chromosome 25: 32,031,536–32,208,713). Unique initiation exons are represented by white boxes (Exons 1 Alpha, 1 Beta, and 1 Gamma), additional exons are represented by grey boxes, and the first shared exon is represented by a black box (Exon 5). Lengths of exons and introns are indicated. The isoform null mutations generated by CRISPR/Cas9 for each single and double mutant line (b# designates alleles) are indicated below each Exon 1 (white box). Symbols indicate deletion (Δ) or insertion (∇) of the indicated number of base pairs. The location of the in-frame V5 epitope tag for each isoform is indicated in magenta above each Exon 1. C. Schematic diagram representing the alternatively initiated tjp1b/ZO1b isoform mRNAs tjp1b/ZO1b-Alpha (ENSDART00000173656.2; 7618 bp), -Beta (ENSDART00000155992.3; 7626 bp) and -Gamma (ENSDART00000112588.5; 7408 bp). Unique 5’UTRs and initiation exons are represented by white boxes, additionally spliced exons are represented by grey boxes and exons shared by all three isoforms are represented by black boxes (Exons 5–31). Approximate location of the ATG start codon and the shared TGA stop codon are indicated in each transcript. D. Schematic diagram of the ZO1b isoform proteins representing ZO1b-Alpha (2005 aa), -Beta (1853 aa), and -Gamma (1689 aa). The unique N-terminal amino acid sequences are indicated in the dashed box. Note that ZO1b-Alpha and ZO1b-Beta both contain amino acid sequence derived from exons 3 and 4. Domains are depicted as white shapes; CARD, PDZ, SH3, GUK and ZU5 are protein-protein interaction modules. White bars represent regions derived from unique initiation exons, grey bars represent regions derived from additionally spliced exons and black bars represent regions derived from shared exons.
|