|
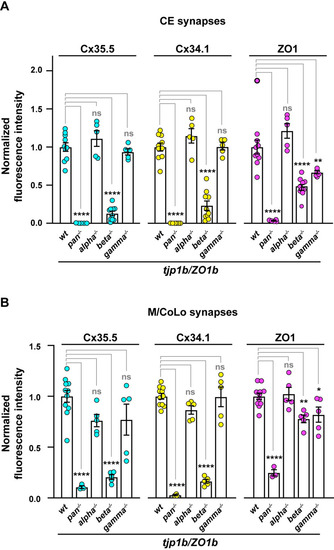
Quantification of ZO1 isoform mutants. A. Quantification of Cx35.5, Cx34.1, and ZO1 fluorescence intensities at CE synapses for the noted genotypes. The height of the bar represents the mean of the sampled data normalized to the wt average. Circles represent the normalized value of each individual animal. Mean is shown ± SEM. wt n = 10; tjp1b/ZO1b-pan-/- n = 5, tjp1b/ZO1b-alpha-/- n = 5, tjp1b/ZO1b-beta-/- n = 10, and tjp1b/ZO1b-gamma-/- n = 5. For Cx35.5 (cyan circles), **** indicates p<0.0001 by ANOVA with Dunnett’s test. For Cx34.1 (yellow circles), **** indicates p<0.0001 by ANOVA with Dunnett’s test. For ZO1 (magenta circles), **** indicates p<0.0001 and ** indicates p = 0.0093 by ANOVA with Dunnett’s test. B. Quantification of Cx35.5, Cx34.1, and ZO1 fluorescence intensities at M/CoLo synapses for the noted genotypes. The height of the bar represents the mean of the sampled data normalized to the wt average. Circles represent the normalized value of each individual animal. Mean is shown ± SEM. wt n = 11, tjp1b/ZO1b-pan-/- n = 3, tjp1b/ZO1b-alpha-/- n = 5, tjp1b/ZO1b-beta-/- n = 5, and tjp1b/ZO1b-gamma-/- n = 5. For Cx35.5 (cyan circles), **** indicates p<0.0001 by ANOVA with Dunnett’s test. For Cx34.1 (yellow circles), **** indicates p<0.0001 by ANOVA with Dunnett’s test. For ZO1 (magenta circles), **** indicates p<0.0001, ** indicates p = 0.008, and * indicates p = 0.0364 by ANOVA with Dunnett’s test.
|