FIGURE SUMMARY
Title

A synaptic corollary discharge signal suppresses midbrain visual processing during saccade-like locomotion

Authors
Ali, M.A., Lischka, K., Preuss, S.J., Trivedi, C.A., Bollmann, J.H.
Source
Full text @ Nat. Commun.

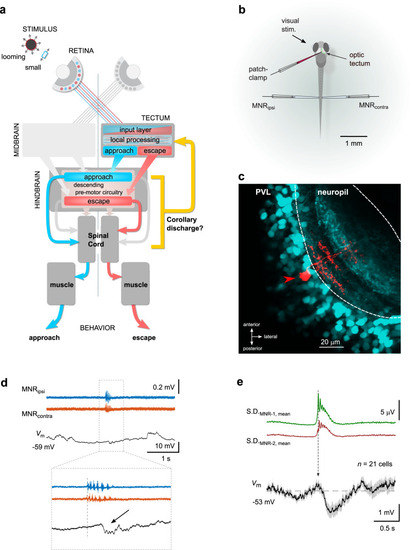
Patch-clamp recordings reveal a motor-related voltage signal in tectal neurons.

a Schematic of the visuomotor pathway in larval zebrafish, including the retina, the optic tectum, hindbrain premotor circuits, spinal cord and axial tail muscles. Visual stimuli of different behavioral value (e.g. loom vs small, prey-like) are processed in the contralateral tectal hemisphere and trigger aversive (escape, red) or target-directed swims (approach, blue) through parallel pathways into the hindbrain premotor circuitry. Putative swim-related feedback signals may affect tectal visual processing during phases of swimming (corollary discharge, yellow). b Recording configuration. Whole-cell patch clamp recording from a tectal neuron is combined with bilateral extracellular field recordings from tail motor nerves (MNRipsi and MNRcontra). c Recorded tectal neuron (red) labeled with sulforhodamine-B via the patch pipette in Tg(pou4f1-hsp70l:GFP) transgenic background (cyan). PVL periventricular cell body layer. Micrograph representative of 56 independent experiments. d Example recording of membrane voltage (Vm, black) in a tectal neuron during a spontaneous fictive swim bout (MNRipsi, MNRcontra, blue and red, respectively). Inset: magnified view of swim event (onset indicated by dotted line). Note the associated short hyperpolarization in the voltage trace (arrow). e Swim-triggered average of voltage signals in tectal neurons (bottom solid trace: mean; shaded area: ± SEM; average across 21 individual, baseline-subtracted cell averages). Vm traces were aligned by the onset of swimming (vertical arrow), measured as the first burst in a fictive swim bout. Top: Standard deviation traces of motor nerve recordings (average from 330 swim events). Source data are provided as a Source Data file.

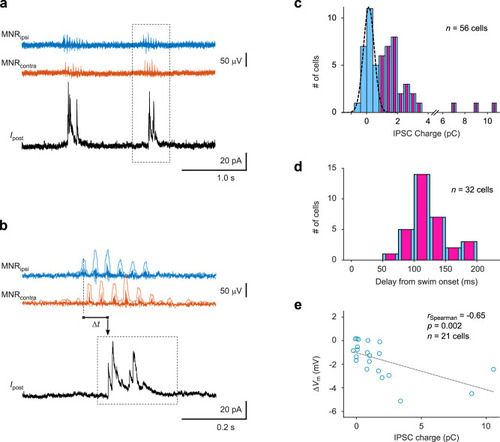
During spontaneous swim bouts, tectal neurons receive motor-related phasic inhibition.

a Example recording of inhibitory membrane currents (Ipost) during spontaneous fictive swim activity. Swim events (bursts in the MNRipsi and MNRcontra traces) are closely followed by short-lasting, large inhibitory postsynaptic currents (IPSCs) in a tectal neuron. Holding potential was +10 mV. b Magnified view of the second event from (a). IPSC charge was measured in a 250 ms window (dotted rectangle). Delay (Δt) was measured between the first burst in the swim bout and the IPSC onset. MNR traces are overlaid with traces representing their standard deviation (see Methods). c Histogram of inhibitory charge transfer in tectal neurons associated with spontaneous swimming (individual cell averages from n = 56 neurons). Dashed curve: Gaussian fit to the left peak of the charge histogram. In the majority of cells (n = 32), inhibitory charge transfer was larger 0.8 pC (bars co-labeled in magenta), indicating non-negligible inhibitory swim-related input. d Histogram of delays between swim onset and IPSC onset. Individual cell averages from n = 32 cells with non-negligible inhibitory swim-related input. e Scatter plot of swim-related transient hyperpolarization measured in current clamp (ΔVm) and IPSC charge transfer measured in voltage clamp from a subset of cells in (c) where both modes of recording were applied (n = 21; 8 cells with IPSC charge <0.8 pC, 13 cells with charge >0.8 pC). ΔVm and IPSC charge are negatively correlated (rSpearman = −0.65, p = 0.002, Spearman rank correlation), which also holds if the two rightmost data points are excluded from correlation analysis (p = 0.014, see Supplementary Fig. 1e). Source data are provided as a Source Data file.

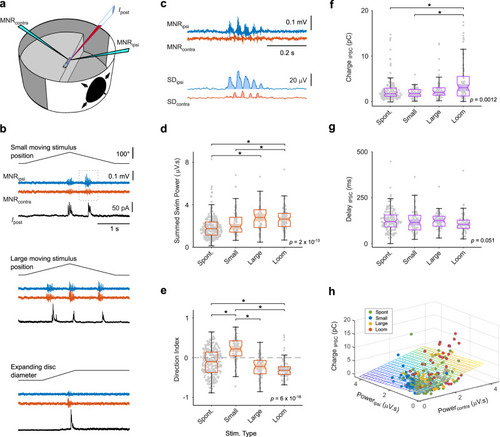
Fast inhibitory currents in tectal cells during visually driven, directed swimming.

a Recording configuration. Visual stimuli are projected on the side wall of the cylindrical arena. b Simultaneous bilateral recording of motor nerve activity (MNRipsi,contra) and patch clamp recording from a tectal cell (Ipost) during different, visually evoked swims. All traces from same neuron. c Motor nerve recording during small stimulus presentation (from rectangle in b) exhibits stronger activity on the side ipsilateral to the stimulus. Lower traces: standard deviation of motor nerve recording (10 ms moving window). Shaded areas indicate swim power on the ipsi- (blue) and contralateral (red) side. d Sum of ipsi- and contralateral swim power is different for spontaneous and visually evoked swims (p = 2 × 10−13, Kruskal-Wallis test, n = 493 bouts from 56 larvae). Swims in response to large rectangles and looms are stronger than spontaneous swims (Large vs. Spont: p = 2 × 10−7; Loom vs. Spont: p = 2 × 10−10; Loom vs. Small: p = 0.017). e Directional indices of spontaneous and visually evoked swims exhibit significant differences consistent with stimulus type (p = 6 × 10−18, Kruskal–Wallis test). Small vs. Spont: p = 5 × 10−10; Loom vs. Spont: p = 8 × 10−5; Large vs. Small: p = 8 × 10−11; Loom vs. Small: p = 8 ×10⁻¹⁸. Same data as in d. f Inhibitory charge transfer during spontaneous and visually evoked swims differs between swim types (p = 0.0012, Kruskal–Wallis test). Data from recordings of cells with non-negligible charge transfer (>0.8 pC, magenta cells in Fig. 2c; 345 events from 32 cells). Loom vs. Spont: p = 0.003; Loom vs. Small: p = 0.0027. g Delays between swim onset and IPSC onset for spontaneous and visually evoked swims exhibit no significant differences (p = 0.051). Statistical differences between groups in panels dg were evaluated using Kruskal–Wallis tests with post-hoc pairwise comparison using Tukey-Kramer method for multiple comparisons. Box-and-whisker plots in panels dg indicate the median, and upper and lower quartiles (box edges). Whiskers: upper and lower limit of data range, up to a maximum of 1.5x interquartile range. h Scatter plot of IPSC charge associated with different swim types. Colored plane represents multiple regression model of charge transfer as a function of swim power in the ipsi- and contralateral motor nerve recording (F-test for multiple regression model: R2 = 0.11; F-statistic = 20.6; p = 3.5 ×10⁻⁹). Regression coefficient for contralateral swim power is significantly different from 0 (t-statistic = 6.42, p = 4.4 × 10−10), but not for ipsilateral swim power (t-statistic = −1.81, p = 0.07). See also Supplementary Fig. 2. Source data are provided as a Source Data file.

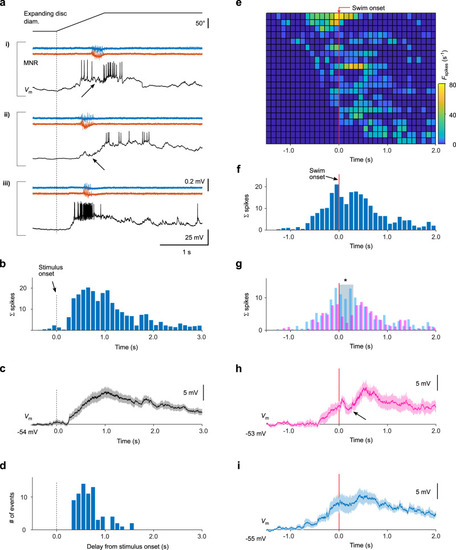
Swim-related inhibition transiently suppresses visually evoked spike output.

a Motor nerve recordings (MNR) of looming-evoked swim events and simultaneously recorded spiking activity (Vm) in three different neurons (i–iii). Stimulus onset indicated by vertical dashed line. b Population spike time histogram, evoked by looming stimuli. Spikes were counted in 100 ms bins, averaged across sweeps for each cell and then summed over all cells (n = 21 cells). c Membrane voltage change of the recorded cells in response to looming stimuli. Average across individual, baseline-subtracted cell averages (n = 21 cells, mean ± SEM). Spikes removed by interpolation between spike onset and offset. d Delay histogram of fictive swim events relative to stimulus onset. e Histogram of instantaneous spike rate, evoked by looming stimuli, aligned to swim onset. Each row represents spiking activity from one cell (n = 21). Rows in histogram vertically sorted according to onset of cell spiking relative to swim onset. f Population spike time histogram, aligned to swim onset (vertical red line), summed over all cells shown in e. g Population spike time histograms as in f, but plotted separately for cells with inhibitory charge transfer >0.8 pC (magenta), and those with negligible inhibitory charge (<0.8 pC, blue). The total spike count summed in a 300-ms window following swim onset (gray bar) is significantly smaller in the inhibited cell population (magenta) than in the population without inhibition (one-tailed comparison of measured vs predicted spike counts using Poisson statistics; p = 4.6 × 10−5). h, i Membrane voltage traces (spikes removed by interpolation), aligned to swim onset. Note the transient decrease in membrane voltage during swimming for cells receiving swim-related inhibition (arrow in panel h; average drop in Vm = −2.8 ± 0.9 mV, n = 10 cells, p = 0.014, two-sided Wilcoxon signed-rank test), but not in cells with negligible charge transfer (panel i; average drop in Vm = −0.6 ± 0.9 mV, n = 11 cells, p = 0.7). Traces show averages across individual, baseline-subtracted cell averages (mean ± SEM, n = 10 cells in h, n = 11 cells in i). See also Supplementary Fig. 3. Source data are provided as a Source Data file.

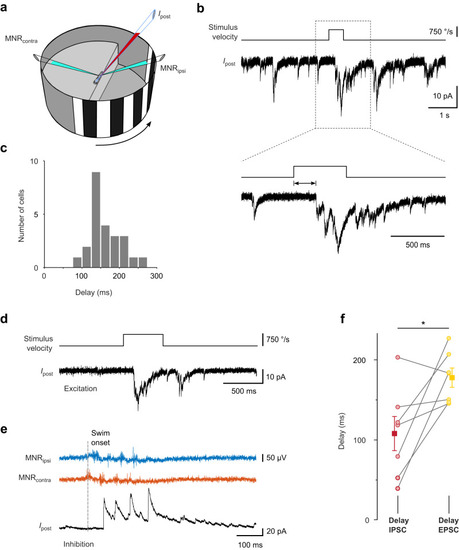
Delay of excitatory input evoked by fast whole-field motion stimuli.

a Experimental configuration. Excitatory currents were recorded in voltage clamp (holding potential −60 mV) from cell contralateral to the stimulus. A stationary grating was shown, which abruptly moved backward, simulating reafferent whole-field visual motion during discrete swim bouts. b Example recording of EPSCs (Ipost) during presentation of grating, which moved rapidly for 0.5 s (top trace). EPSC delays were measured from onset of stimulus movement (magnified view, bottom traces). c Histogram of delays between stimulus onset and EPSC onset. Individual cell averages from n = 24 cells (161.3 ms ± 8.2 ms; mean ± SEM). d Example recording of moving grating-evoked EPSC (Vhold: −60 mV) in a cell in which also spontaneous swim-related inhibition was measured. e Example recording of IPSC (Vhold: 10 mV) following a spontaneous swim bout. Same cell as in d. f Pairwise comparison of swim-related IPSC delays (red) and delays of EPSCs from the onset of visual grating motion (yellow), measured in the same cells. Individual cell averages from n = 7 cells (circles). Squares and error bars indicate mean ± SEM across cells (EPSC: 178 ms ± 12 ms; IPSC: 108 ms ± 21 ms). Pair-wise difference: 70 ± 25 ms (mean ± SEM, p = 0.047, two-sided Wilcoxon signed-rank test). For analysis of EPSC delays, trials in which the visual stimulus evoked swimming were excluded. Source data are provided as a Source Data file.

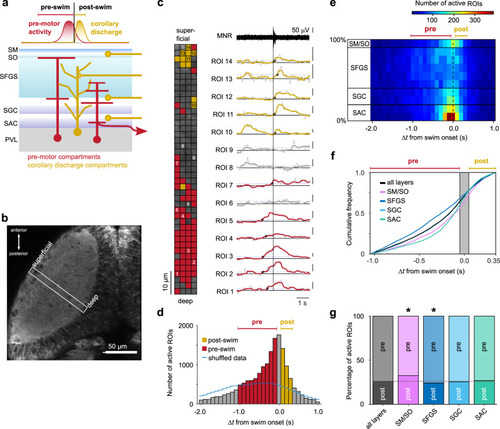
Spatial distribution of swim-related Ca2+ signals in the tectal neuropil.

a Schematic of tectal layers, showing interneurons, projection neurons and incoming axons that could mediate premotor (red) or corollary discharge activity (yellow), respectively. b Tectal hemisphere in Tg(elavl3:GCaMP5G), dorsal view. Ca2+ imaging was performed in a rectangular scan area (white box) covering deep to superficial neuropil during spontaneous fictive swims. Image representative of recordings from 15 larvae. c Example of fluorescence transients (right traces) from small ROIs in the neuropil around swim onset (vertical line). Traces are from numbered ROIs in left inset. (Scale bars: 0.4 ΔF/F; raw traces overlaid with median-filtered traces, see ”Methods” section). Onset times of Ca2+ transients marked by circles. ROIs were considered ‘active’ with respect to the swim event if a peak was detected whose onset fell in the interval [−1.05 s; 0.35 s] around swim onset (colored traces; see Supplementary Fig. 4). ROIs in inset and ΔF/F traces are colored according to whether their onset was categorized ‘pre-swim’ (red), ‘post-swim’ (yellow), or ‘inactive’ (gray). d Histogram of active ROI onsets in relation to swim onset. Active ROIs with onset in the central bin (gray bar at 0 s) were excluded from categorization. Blue line indicates control distribution of active ROIs when fluorescence data was shuffled circularly. Data from 315 spontaneous swims in 15 larvae; total of 16890 active ROIs. e Space-time histogram of active ROIs. Active ROIs from d were binned according to location in the neuropil (spatial bin size: 10%). Spatial bins are grouped according to anatomical layers: 0-20%: SAC; 20-40%: SGC; 40-90%: SFGS; 90-100%: SM/SO. f Cumulative distributions of active ROIs, pooled over all layers (black trace), and pooled separately for the different neuropil regions indicated in e. The cumulative distributions for SM/SO, SFGS and SAC were different from that summed across all layers (SM/SO: p = 5.7 × 10−7; SFGS: p = 7.5 × 10−29; SAC: 9.8 × 10−33; SGC: p = 1.0. Kolmogorov-Smirnov tests with Bonferroni adjustment of p-values for multiple comparisons). g Fractions of active ROIs classified in d as ‘pre-swim’ or ‘post-swim’, pooled over all layers and pooled separately for the different neuropil regions. In SM/SO, Ca2+ transients occurred more frequently in the post-swim interval (32.5%, p = 2.3 × 10−6) compared to the fraction measured across all layers (26.0%, horizontal dashed line). In SFGS, Ca2+ transients occurred less frequently in the post-swim interval (24.2%, p = 1.1 × 10−2). In SGC and SAC the fractions were not significantly different from that across all layers (p = 1.0 in both cases; all p-values from two-sided binomial tests with Bonferroni adjustment of p-values for multiple comparisons). Events around swim onset (gray bar in f) were excluded from categorization. Source data are provided as a Source Data file.

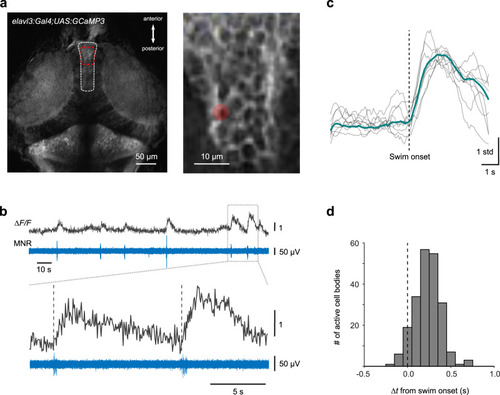
Temporal distribution of swim-related Ca2+ signals in the torus longitudinalis (TL).

a TL (dashed white outline) in Tg(elavl3:Gal4-VP16;UAS:GCaMP3), (dorsal view). Rapid Ca2+ imaging (8−27 Hz) was performed in a rectangular scan area (red box; magnified view in right inset) during spontaneous fictive swimming in the absence of visual stimulation. Image representative for independent recordings from 5 larvae. b Example of fluorescence transients (ΔF/F) from cell body in the TL (red circle marked in (a, right inset). ΔF/F transients coincide with spontaneous swim bouts, recorded simultaneously (MNR, bottom). Onset of ΔF/F transients occurs around swim onset (vertical dashed lines in magnified view, lower traces). c Swim-triggered average (green trace) of ΔF/F transients from cell shown in b. Individual ΔF/F transients (gray traces) were z-scored prior to averaging. d Histogram of ΔF/F transient delays from swim onset measured in TL cell bodies. (n = 214 cells from 5 larvae). Source data are provided as a Source Data file.

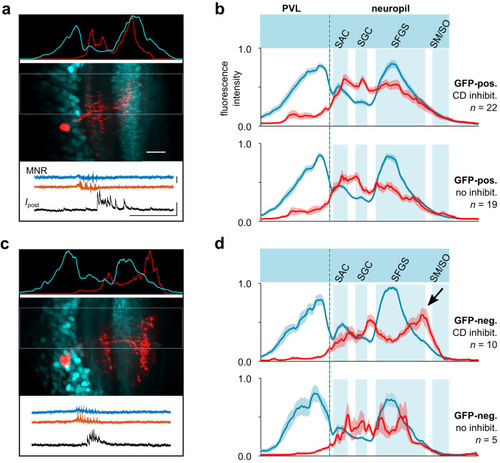
Dendritic profiles of tectal cells with CD synaptic inhibition.

a Dendritic profile of a recorded GFP-positive neuron labeled with sulforhodamine (red) in the Tg(pou4f1-hsp70l:GFP) line (cyan). Scale bar 20 μm. Profiles of fluorescence intensity (top inset, peak-scaled) were measured separately in the red and cyan channel of the dual color image (center) across the PVL and neuropil (rectangular area in center image). The recorded neuron received CD inhibitory postsynaptic currents associated with swimming (bottom inset). Scale bars MNR: 50 μV, Ipost 50 pA, time: 500 ms). b Average dendritic profiles of recorded GFP-positive neurons, for cells with motor-related, CD inhibition (top) and without CD inhibition (bottom). Profiles were aligned with respect to the PVL/neuropil boundary (vertical dashed line) and the peak of the SFGS and averaged (cyan traces, mean ± SEM). Profiles of neurons (red) exhibit dendrites mostly in SAC, SGC and central SFGS, but not in more superficial layers. Shaded areas indicate approximate extent of neuropil layers. c Same as in a, but for a GFP-negative neuron patched in the Tg(pou4f1-hsp70l:GFP) line. Note the bistratified dendritic profile, with the upper dendrites in target layers more dorsal to those of GFP-positive neurons. d Same as in b, but for GFP-negative neurons patched in the Tg(pou4f1-hsp70l:GFP) line. Note the peak of dendritic profiles superficial to the SFGS (arrow). Source data are provided as a Source Data file.

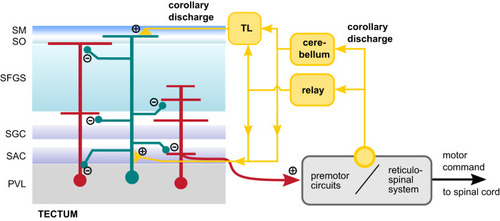
Putative mechanism of CD signaling in the visuomotor pathway.

Hypothesized organization of inhibitory CD signaling in the tectum. Diverse cell types in the tectum (red cells) receive motor-related inhibitory inputs during swimming. The CD signal is initiated at unknown sites in premotor circuitry controlling tail and eye movements (yellow circle) and is relayed to the tectum, possibly via the cerebellum, or other relay nodes. Because post-swim Ca2+ signals cluster in the most superficial layer containing the stratum marginale (SM) where axons from TL projection neurons form a narrow input layer, TL is a likely pathway whereby CD signals reach the tectum. This is supported by transient post-swim activity observed in TL neurons (Fig. 7). Similarly, afferents from the cerebellum, or from other relay nodes, which preferentially terminate in deep neuropil layers containing the SAC, could form another input channel for CD signals. Because projection neurons from both the TL and the cerebellum are mainly glutamatergic, this model posits that the afferent CD signal is sign-converted by local inhibitory interneurons (green). As CD likely enters the tectum via superficial TL fibers, this interneuron type is expected to receive excitatory input in the SM/SO and distribute inhibitory signals across several neuropil layers. This could explain how neurons with only deep dendritic branches (Fig. 8) receive phasic inhibitory inputs despite a lack of dendrites in the more superficial layers (red neuron on the right).

Acknowledgments
This image is the copyrighted work of the attributed author or publisher, and ZFIN has permission only to display this image to its users. Additional permissions should be obtained from the applicable author or publisher of the image. Full text @ Nat. Commun.