|
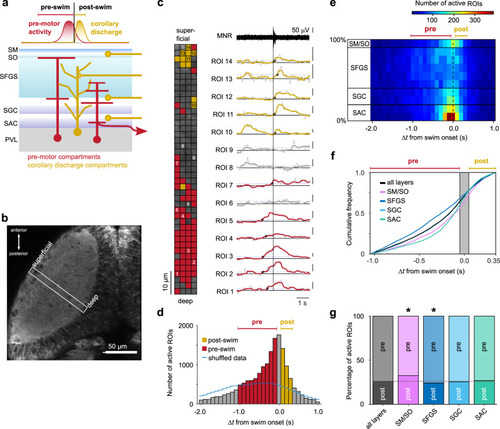
Spatial distribution of swim-related Ca2+ signals in the tectal neuropil. a Schematic of tectal layers, showing interneurons, projection neurons and incoming axons that could mediate premotor (red) or corollary discharge activity (yellow), respectively. b Tectal hemisphere in Tg(elavl3:GCaMP5G), dorsal view. Ca2+ imaging was performed in a rectangular scan area (white box) covering deep to superficial neuropil during spontaneous fictive swims. Image representative of recordings from 15 larvae. c Example of fluorescence transients (right traces) from small ROIs in the neuropil around swim onset (vertical line). Traces are from numbered ROIs in left inset. (Scale bars: 0.4 ΔF/F; raw traces overlaid with median-filtered traces, see ”Methods” section). Onset times of Ca2+ transients marked by circles. ROIs were considered ‘active’ with respect to the swim event if a peak was detected whose onset fell in the interval [−1.05 s; 0.35 s] around swim onset (colored traces; see Supplementary Fig. 4). ROIs in inset and ΔF/F traces are colored according to whether their onset was categorized ‘pre-swim’ (red), ‘post-swim’ (yellow), or ‘inactive’ (gray). d Histogram of active ROI onsets in relation to swim onset. Active ROIs with onset in the central bin (gray bar at 0 s) were excluded from categorization. Blue line indicates control distribution of active ROIs when fluorescence data was shuffled circularly. Data from 315 spontaneous swims in 15 larvae; total of 16890 active ROIs. e Space-time histogram of active ROIs. Active ROIs from d were binned according to location in the neuropil (spatial bin size: 10%). Spatial bins are grouped according to anatomical layers: 0-20%: SAC; 20-40%: SGC; 40-90%: SFGS; 90-100%: SM/SO. f Cumulative distributions of active ROIs, pooled over all layers (black trace), and pooled separately for the different neuropil regions indicated in e. The cumulative distributions for SM/SO, SFGS and SAC were different from that summed across all layers (SM/SO: p = 5.7 × 10⁻⁷; SFGS: p = 7.5 × 10⁻²⁹; SAC: 9.8 × 10⁻³³; SGC: p = 1.0. Kolmogorov-Smirnov tests with Bonferroni adjustment of p-values for multiple comparisons). g Fractions of active ROIs classified in d as ‘pre-swim’ or ‘post-swim’, pooled over all layers and pooled separately for the different neuropil regions. In SM/SO, Ca2+ transients occurred more frequently in the post-swim interval (32.5%, p = 2.3 × 10⁻⁶) compared to the fraction measured across all layers (26.0%, horizontal dashed line). In SFGS, Ca2+ transients occurred less frequently in the post-swim interval (24.2%, p = 1.1 × 10⁻²). In SGC and SAC the fractions were not significantly different from that across all layers (p = 1.0 in both cases; all p-values from two-sided binomial tests with Bonferroni adjustment of p-values for multiple comparisons). Events around swim onset (gray bar in f) were excluded from categorization. Source data are provided as a Source Data file.
|