|
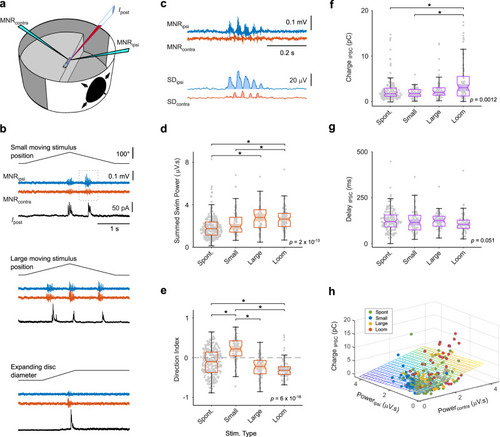
Fast inhibitory currents in tectal cells during visually driven, directed swimming. a Recording configuration. Visual stimuli are projected on the side wall of the cylindrical arena. b Simultaneous bilateral recording of motor nerve activity (MNRipsi,contra) and patch clamp recording from a tectal cell (Ipost) during different, visually evoked swims. All traces from same neuron. c Motor nerve recording during small stimulus presentation (from rectangle in b) exhibits stronger activity on the side ipsilateral to the stimulus. Lower traces: standard deviation of motor nerve recording (10 ms moving window). Shaded areas indicate swim power on the ipsi- (blue) and contralateral (red) side. d Sum of ipsi- and contralateral swim power is different for spontaneous and visually evoked swims (p = 2 × 10⁻¹³, Kruskal-Wallis test, n = 493 bouts from 56 larvae). Swims in response to large rectangles and looms are stronger than spontaneous swims (Large vs. Spont: p = 2 × 10⁻⁷; Loom vs. Spont: p = 2 × 10⁻¹⁰; Loom vs. Small: p = 0.017). e Directional indices of spontaneous and visually evoked swims exhibit significant differences consistent with stimulus type (p = 6 × 10⁻¹⁸, Kruskal–Wallis test). Small vs. Spont: p = 5 × 10⁻¹⁰; Loom vs. Spont: p = 8 × 10⁻⁵; Large vs. Small: p = 8 × 10⁻¹¹; Loom vs. Small: p = 8 ×10⁻¹⁸. Same data as in d. f Inhibitory charge transfer during spontaneous and visually evoked swims differs between swim types (p = 0.0012, Kruskal–Wallis test). Data from recordings of cells with non-negligible charge transfer (>0.8 pC, magenta cells in Fig. 2c; 345 events from 32 cells). Loom vs. Spont: p = 0.003; Loom vs. Small: p = 0.0027. g Delays between swim onset and IPSC onset for spontaneous and visually evoked swims exhibit no significant differences (p = 0.051). Statistical differences between groups in panels d–g were evaluated using Kruskal–Wallis tests with post-hoc pairwise comparison using Tukey-Kramer method for multiple comparisons. Box-and-whisker plots in panels d–g indicate the median, and upper and lower quartiles (box edges). Whiskers: upper and lower limit of data range, up to a maximum of 1.5x interquartile range. h Scatter plot of IPSC charge associated with different swim types. Colored plane represents multiple regression model of charge transfer as a function of swim power in the ipsi- and contralateral motor nerve recording (F-test for multiple regression model: R2 = 0.11; F-statistic = 20.6; p = 3.5 ×10⁻⁹). Regression coefficient for contralateral swim power is significantly different from 0 (t-statistic = 6.42, p = 4.4 × 10⁻¹⁰), but not for ipsilateral swim power (t-statistic = −1.81, p = 0.07). See also Supplementary Fig. 2. Source data are provided as a Source Data file.
|