|
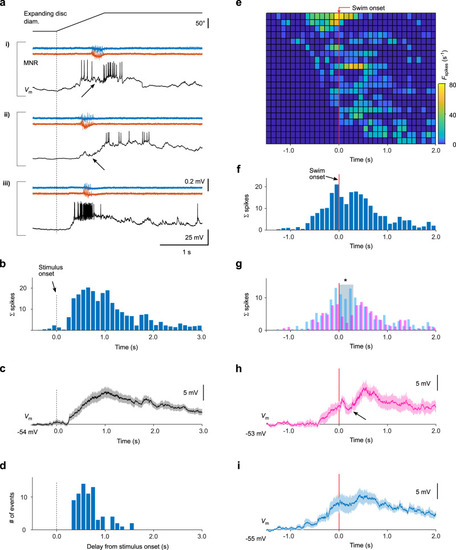
Swim-related inhibition transiently suppresses visually evoked spike output. a Motor nerve recordings (MNR) of looming-evoked swim events and simultaneously recorded spiking activity (Vm) in three different neurons (i–iii). Stimulus onset indicated by vertical dashed line. b Population spike time histogram, evoked by looming stimuli. Spikes were counted in 100 ms bins, averaged across sweeps for each cell and then summed over all cells (n = 21 cells). c Membrane voltage change of the recorded cells in response to looming stimuli. Average across individual, baseline-subtracted cell averages (n = 21 cells, mean ± SEM). Spikes removed by interpolation between spike onset and offset. d Delay histogram of fictive swim events relative to stimulus onset. e Histogram of instantaneous spike rate, evoked by looming stimuli, aligned to swim onset. Each row represents spiking activity from one cell (n = 21). Rows in histogram vertically sorted according to onset of cell spiking relative to swim onset. f Population spike time histogram, aligned to swim onset (vertical red line), summed over all cells shown in e. g Population spike time histograms as in f, but plotted separately for cells with inhibitory charge transfer >0.8 pC (magenta), and those with negligible inhibitory charge (<0.8 pC, blue). The total spike count summed in a 300-ms window following swim onset (gray bar) is significantly smaller in the inhibited cell population (magenta) than in the population without inhibition (one-tailed comparison of measured vs predicted spike counts using Poisson statistics; p = 4.6 × 10⁻⁵). h, i Membrane voltage traces (spikes removed by interpolation), aligned to swim onset. Note the transient decrease in membrane voltage during swimming for cells receiving swim-related inhibition (arrow in panel h; average drop in Vm = −2.8 ± 0.9 mV, n = 10 cells, p = 0.014, two-sided Wilcoxon signed-rank test), but not in cells with negligible charge transfer (panel i; average drop in Vm = −0.6 ± 0.9 mV, n = 11 cells, p = 0.7). Traces show averages across individual, baseline-subtracted cell averages (mean ± SEM, n = 10 cells in h, n = 11 cells in i). See also Supplementary Fig. 3. Source data are provided as a Source Data file.
|