IMAGE

Fig. 5

ID
ZDB-IMAGE-231127-80
Source
Figures for Ali et al., 2023
Image
Figure Caption

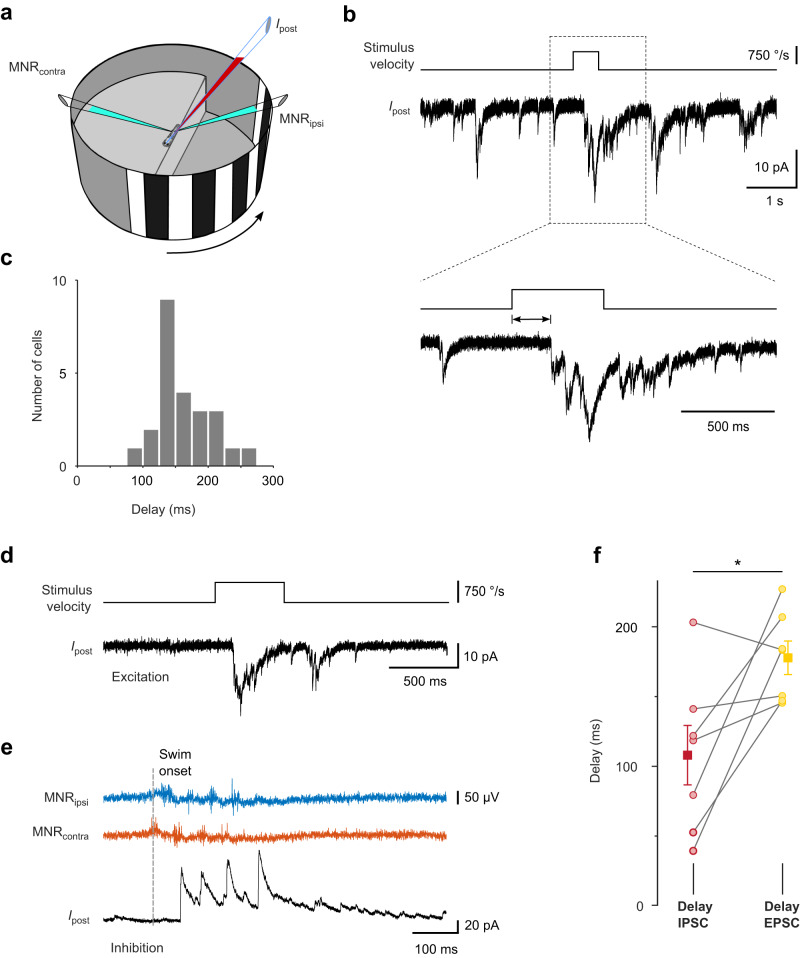
Fig. 5 Delay of excitatory input evoked by fast whole-field motion stimuli.

a Experimental configuration. Excitatory currents were recorded in voltage clamp (holding potential −60 mV) from cell contralateral to the stimulus. A stationary grating was shown, which abruptly moved backward, simulating reafferent whole-field visual motion during discrete swim bouts. b Example recording of EPSCs (Ipost) during presentation of grating, which moved rapidly for 0.5 s (top trace). EPSC delays were measured from onset of stimulus movement (magnified view, bottom traces). c Histogram of delays between stimulus onset and EPSC onset. Individual cell averages from n = 24 cells (161.3 ms ± 8.2 ms; mean ± SEM). d Example recording of moving grating-evoked EPSC (Vhold: −60 mV) in a cell in which also spontaneous swim-related inhibition was measured. e Example recording of IPSC (Vhold: 10 mV) following a spontaneous swim bout. Same cell as in d. f Pairwise comparison of swim-related IPSC delays (red) and delays of EPSCs from the onset of visual grating motion (yellow), measured in the same cells. Individual cell averages from n = 7 cells (circles). Squares and error bars indicate mean ± SEM across cells (EPSC: 178 ms ± 12 ms; IPSC: 108 ms ± 21 ms). Pair-wise difference: 70 ± 25 ms (mean ± SEM, p = 0.047, two-sided Wilcoxon signed-rank test). For analysis of EPSC delays, trials in which the visual stimulus evoked swimming were excluded. Source data are provided as a Source Data file.

Acknowledgments
This image is the copyrighted work of the attributed author or publisher, and ZFIN has permission only to display this image to its users. Additional permissions should be obtained from the applicable author or publisher of the image. Full text @ Nat. Commun.