IMAGE

Fig. 7

ID
ZDB-IMAGE-231127-82
Source
Figures for Ali et al., 2023
Image
Figure Caption

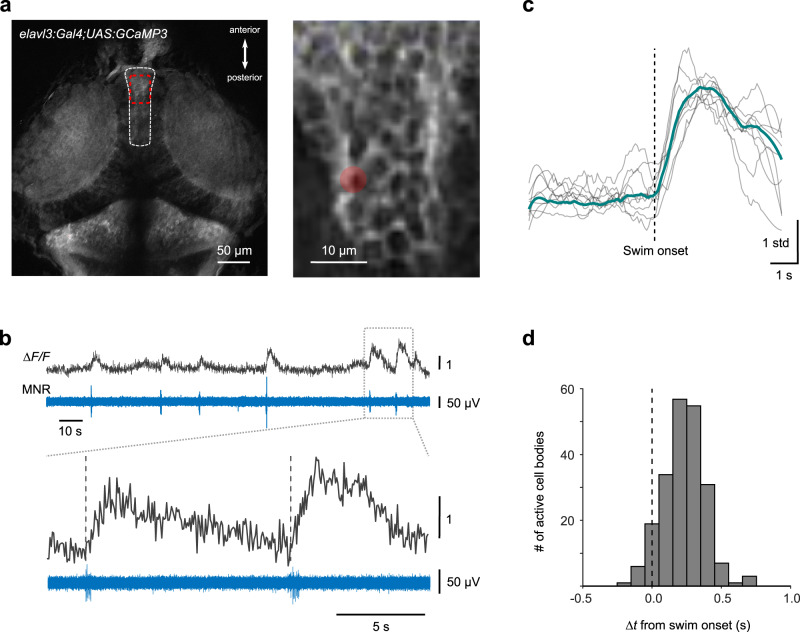
Fig. 7 Temporal distribution of swim-related Ca2+ signals in the torus longitudinalis (TL).

a TL (dashed white outline) in Tg(elavl3:Gal4-VP16;UAS:GCaMP3), (dorsal view). Rapid Ca2+ imaging (8−27 Hz) was performed in a rectangular scan area (red box; magnified view in right inset) during spontaneous fictive swimming in the absence of visual stimulation. Image representative for independent recordings from 5 larvae. b Example of fluorescence transients (ΔF/F) from cell body in the TL (red circle marked in (a, right inset). ΔF/F transients coincide with spontaneous swim bouts, recorded simultaneously (MNR, bottom). Onset of ΔF/F transients occurs around swim onset (vertical dashed lines in magnified view, lower traces). c Swim-triggered average (green trace) of ΔF/F transients from cell shown in b. Individual ΔF/F transients (gray traces) were z-scored prior to averaging. d Histogram of ΔF/F transient delays from swim onset measured in TL cell bodies. (n = 214 cells from 5 larvae). Source data are provided as a Source Data file.

Acknowledgments
This image is the copyrighted work of the attributed author or publisher, and ZFIN has permission only to display this image to its users. Additional permissions should be obtained from the applicable author or publisher of the image. Full text @ Nat. Commun.