
- Title
-
Heterogeneous Cellular Response of Primary and Metastatic Human Gastric Adenocarcinoma Cell Lines to Magnoflorine and Its Additive Interaction with Docetaxel
- Authors
- Grabarska, A., Luszczki, J.J., Gawel, K., Kukula-Koch, W., Juszczak, M., Slawinska-Brych, A., Adamczuk, G., Dmoszynska-Graniczka, M., Kosheva, N., Rzeski, W., Stepulak, A.
- Source
- Full text @ Int. J. Mol. Sci.
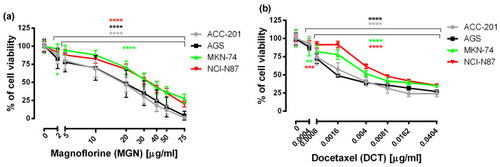
The concentration-related inhibitory effects of MGN ( |
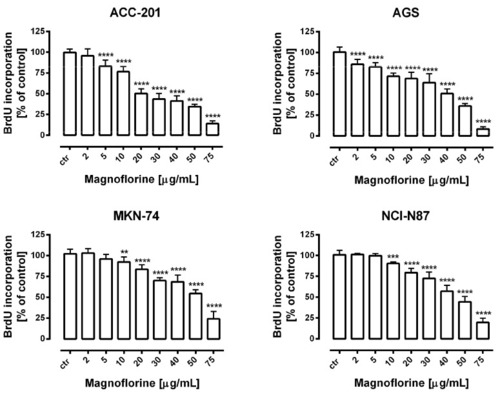
The concentration-dependent inhibitory effects of MGN on the proliferation of human GC cells incubated with selected concentrations of this compound (2–75 μg/mL) for 72 h. Results are expressed as the mean ± SEM of 24 samples from at least three independent experiments. Statistical differences were analyzed using Student’s |
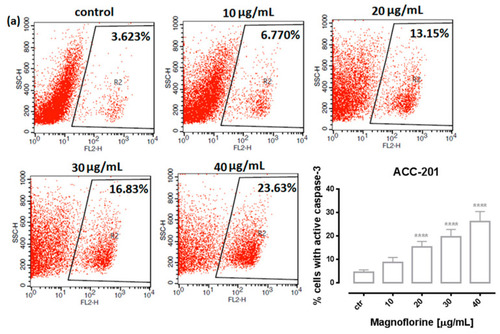
Representative flow cytometry dot plot graphs of ACC-201 ( |
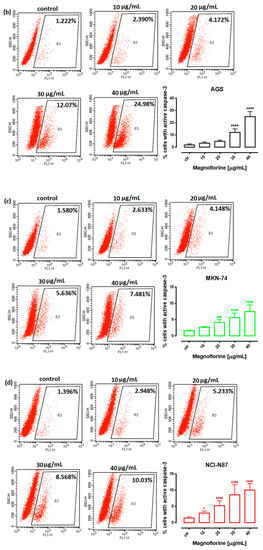
Representative flow cytometry dot plot graphs of ACC-201 ( |
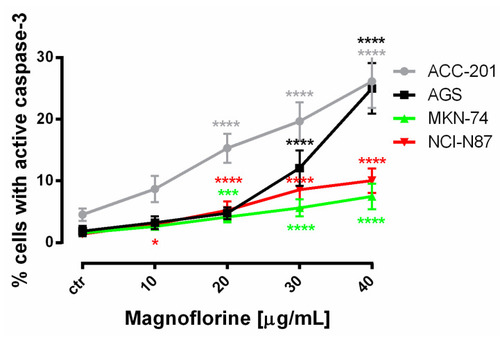
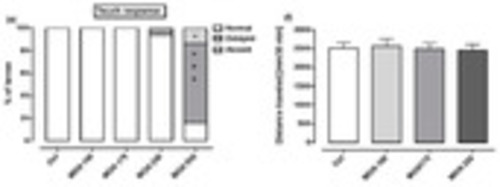
The number of cleaved caspase-3-positive ACC-201, AGS, MKN-74 and NCI-N87 GC cell lines after the treatment with a medium (ctr) and MGN for 72 h. All results are expressed as mean ± SEM of three independent experiments. Statistical differences were analyzed using Student’s |
|
Representative cell cycle progression of the human GC cell lines following MGN treatments for 72 h using a flow cytometer. Representative histograms of PI-stained nuclear DNA content of each cell cycle phase vs. cell counts in untreated control and treated ACC-201 ( 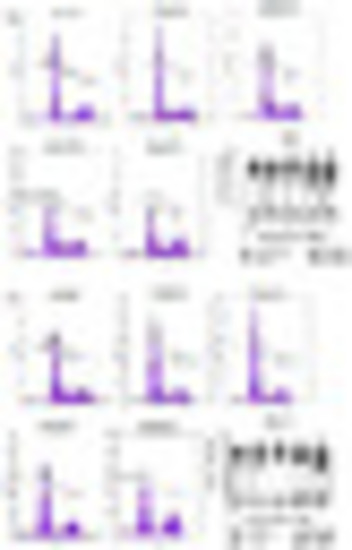
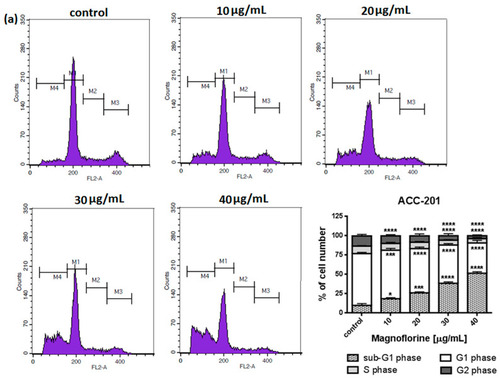
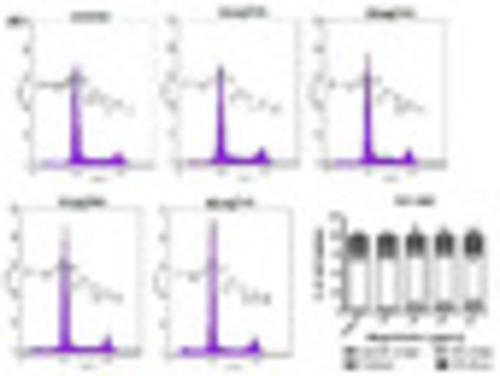
|
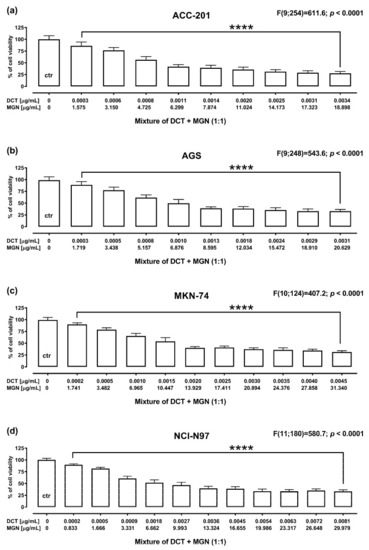
The anti-proliferative effect for the mixture of DCT and MGN administered in combination in ACC-201 ( |
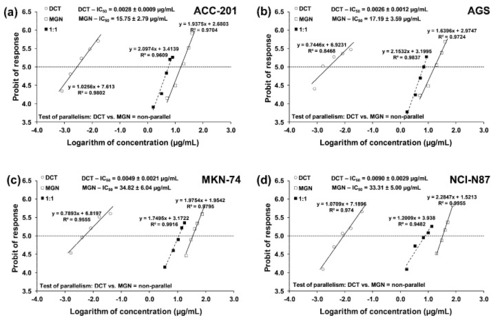
Concentration–effect lines for MGN and DCT administered alone and in combination for 72 h at the fixed-ratio of 1:1, illustrating the anti-proliferative effects of the drugs and their mixture in ACC-201 ( |
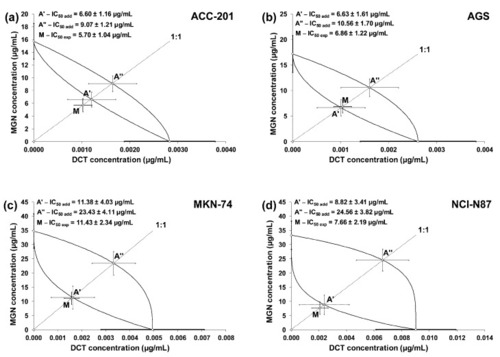
Isobolograms illustrating additive interactions between MGN and DCT with respect to their anti-proliferative effects on ACC-201 ( |
|
( 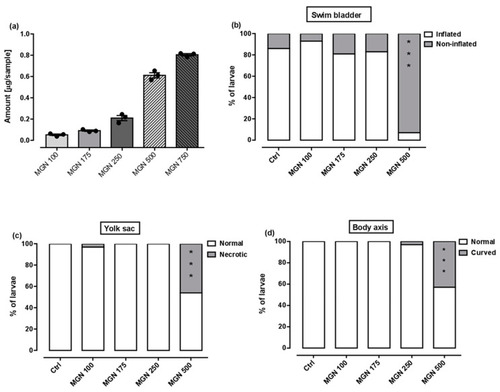
|
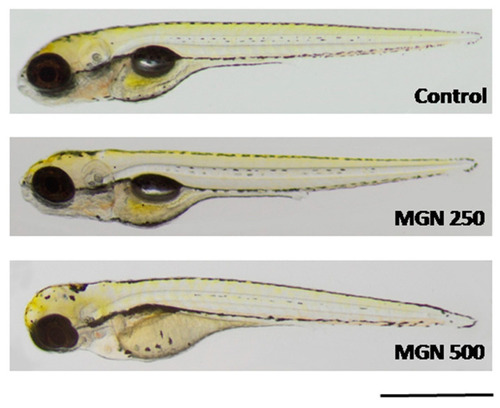
Representative photographs of larvae incubated in MGN (250 or 500 µg/mL). MGN:magnoflorine. Scale bar: 1 mm. |