FIGURE

Figure 8

ID
ZDB-FIG-231116-20
Publication
Grabarska et al., 2023 - Heterogeneous Cellular Response of Primary and Metastatic Human Gastric Adenocarcinoma Cell Lines to Magnoflorine and Its Additive Interaction with Docetaxel
Other Figures
All Figure Page
Back to All Figure Page
Figure 8

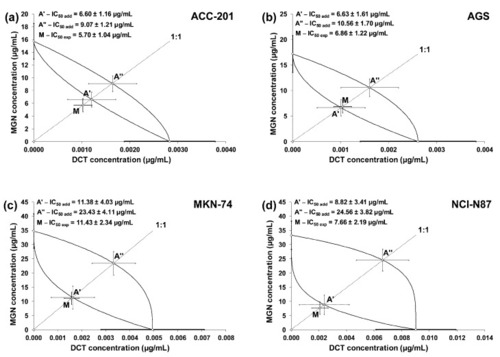
Isobolograms illustrating additive interactions between MGN and DCT with respect to their anti-proliferative effects on ACC-201 (a), AGS (b), MKN-74 (c) and NCI-N87 (d) cell lines measured in vitro using the MTT assay for 72 h. The IC50 ± SEM for MGN and DCT are plotted on the Y- and X-axes, respectively. The points A′ and A″ depict the theoretically calculated IC50add values (±SEM) for both lower and upper isoboles of additivity. The point M on each graph represents the experimentally derived IC50mix value (±SEM) for the mixture, which produced a 50% anti-proliferative effect (50% isobole) in the tested cell lines.

Expression Data

Expression Detail
Antibody Labeling
Phenotype Data

Phenotype Detail
Acknowledgments
This image is the copyrighted work of the attributed author or publisher, and ZFIN has permission only to display this image to its users. Additional permissions should be obtained from the applicable author or publisher of the image. Full text @ Int. J. Mol. Sci.