
FIGURE
Figure 7
- ID
- ZDB-FIG-231116-19
- Publication
- Grabarska et al., 2023 - Heterogeneous Cellular Response of Primary and Metastatic Human Gastric Adenocarcinoma Cell Lines to Magnoflorine and Its Additive Interaction with Docetaxel
- Other Figures
- All Figure Page
- Back to All Figure Page
Figure 7
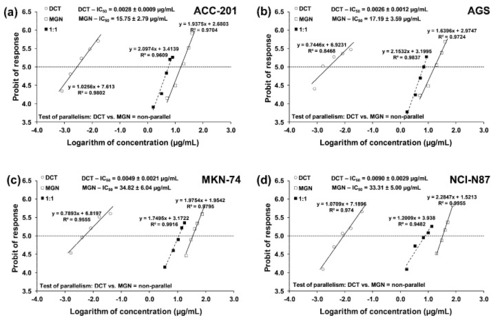
Concentration–effect lines for MGN and DCT administered alone and in combination for 72 h at the fixed-ratio of 1:1, illustrating the anti-proliferative effects of the drugs and their mixture in ACC-201 ( |
Expression Data
Expression Detail
Antibody Labeling
Phenotype Data
Phenotype Detail
Acknowledgments
This image is the copyrighted work of the attributed author or publisher, and
ZFIN has permission only to display this image to its users.
Additional permissions should be obtained from the applicable author or publisher of the image.
Full text @ Int. J. Mol. Sci.