
Image
|
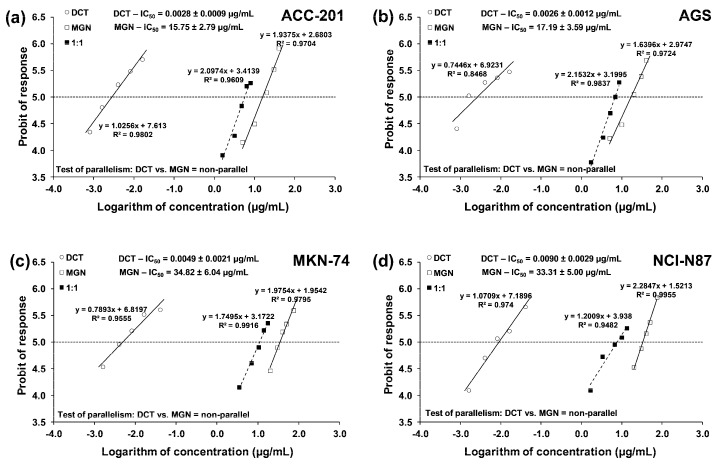
Figure Caption
Figure 7
Concentration–effect lines for MGN and DCT administered alone and in combination for 72 h at the fixed-ratio of 1:1, illustrating the anti-proliferative effects of the drugs and their mixture in ACC-201 (
Acknowledgments
This image is the copyrighted work of the attributed author or publisher, and
ZFIN has permission only to display this image to its users.
Additional permissions should be obtained from the applicable author or publisher of the image.
Full text @ Int. J. Mol. Sci.