
|
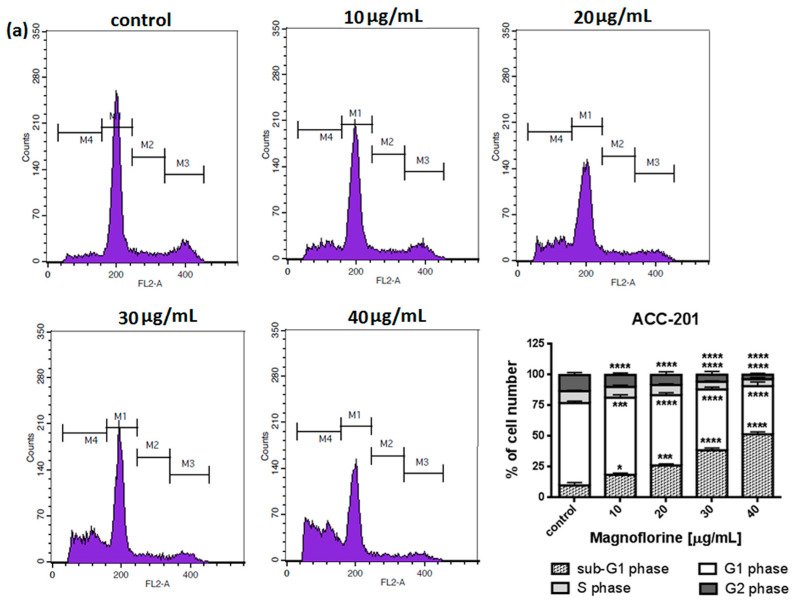
Figure 5
Representative cell cycle progression of the human GC cell lines following MGN treatments for 72 h using a flow cytometer. Representative histograms of PI-stained nuclear DNA content of each cell cycle phase vs. cell counts in untreated control and treated ACC-201 (