
Image
|
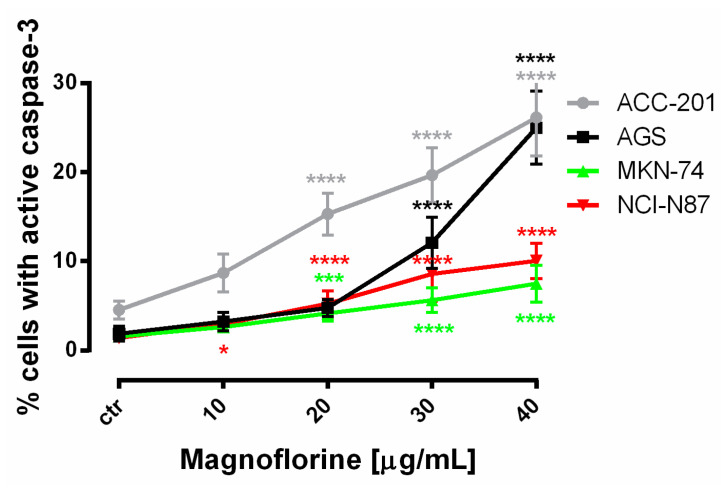
Figure Caption
Figure 4
The number of cleaved caspase-3-positive ACC-201, AGS, MKN-74 and NCI-N87 GC cell lines after the treatment with a medium (ctr) and MGN for 72 h. All results are expressed as mean ± SEM of three independent experiments. Statistical differences were analyzed using Student’s
Acknowledgments
This image is the copyrighted work of the attributed author or publisher, and
ZFIN has permission only to display this image to its users.
Additional permissions should be obtained from the applicable author or publisher of the image.
Full text @ Int. J. Mol. Sci.