
- Title
-
Testing biological actions of medicinal plants from northern Vietnam on zebrafish embryos and larvae: Developmental, behavioral, and putative therapeutical effects
- Authors
- Tran, M.H., Nguyen, T.V.A., Do, H.G., Kieu, T.K., Nguyen, T.K.T., Le, H.D., Guerrero-Limon, G., Massoz, L., Nivelle, R., Zappia, J., Pham, H.T., Nguyen, L.T., Muller, M.
- Source
- Full text @ PLoS One
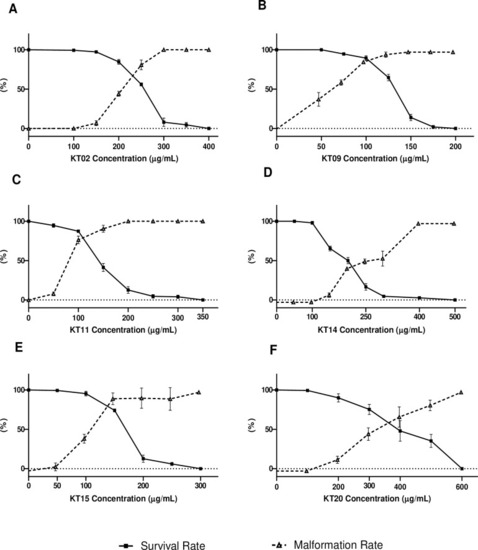
Survival and morphological defects of larvae after exposure to medicinal plant extracts. Fraction of surviving larvae or larvae presenting any morphological defect at 96 hpf upon exposure to KT02 (A), KT09 (B), KT11 (C), KT14 (D), KT15 (E) and KT20 (F). Experiments were performed at least in triplicate with each time n = 50 larvae per point. Fraction of larvae presenting any morphological defects are represented in dotted lines. |
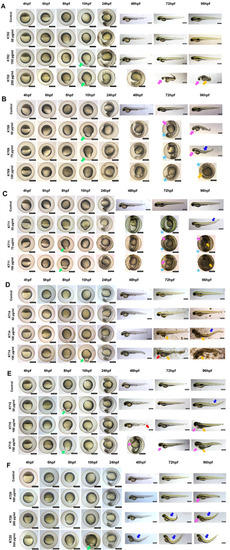
Morphological defects at different time points of exposure. A-F: Representative images of 4–96 hpf larvae exposure to 6 plant extracts at the indicated concentrations. The morphology of embryos was observed and captured under a stereomicroscope. Scale bars = 400 μm. Green arrows indicate dumb-bell shape yolk, blue arrows indicate dorsal curvature, pink arrows indicate yolk sac edema, red arrows indicate hemorrhage orange arrows indicated necrosis, and stars indicate delayed hatching. |
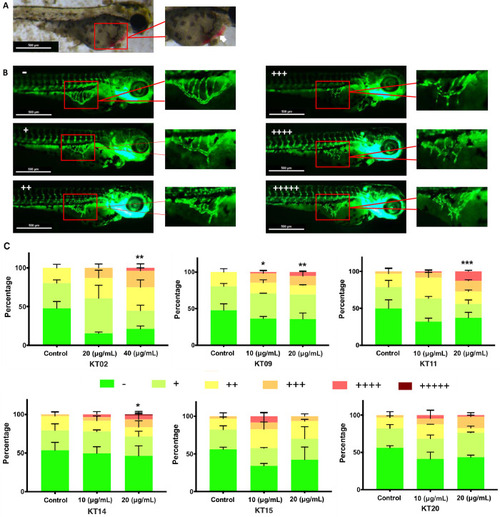
The effects of six plant extracts on blood vessel formation in SIVs of (A) Hemorrhage (white arrow) was observed in 3 dpf zebrafish larvae treated with KT14 150 μg/mL. (B) Microscopic view of blood vessel formation of zebrafish at 72 hpf in the absence and presence of ectopic angiogenesis of Sub intestinal vessels (SIVs), SIVs are marked by a red frame and shown at a higher magnification. The number of “+” is the number of sprouts projecting from the SIVs basket. (C) Quantitative analysis of the percentage of each angiogenic phenotype in SIVs after treatment with the different plant extracts. Sample groups were assessed according to “+”, “++”, “+++”, “++++” and “+++++” representing the percentage of embryos with one, two, three, four or five sprouts projecting out of the SIV regions, respectively. Images were taken using ZEN software. Data present mean ± SD from three independent experiments. Statistical analysis was performed using a two-way ANOVA test, p-values < 0.05 *; 0.01 **; 0.001***. |
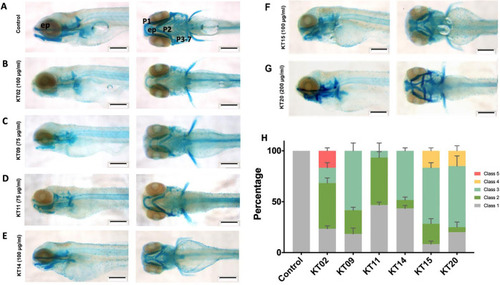
Medicinal plant extracts exposure affects head cartilage formation in zebrafish larvae. Whole-mount preparations of the larva expose to extract of KT02 (B), KT09 (C), KT11 (D), KT14 (E), KT15 (F) and KT20 (G). (A) Control. Scale bar: 200 μm. (H) Statistical analysis of jaw malformations as categorized into different classes. Class 1: No observable change (Control); Class 2: Weak staining in P1 to P7 region and ethmoid plate; Class 3: Shortened jaw structure (P1, P2 and ep); Class 4: Severe structural changes in all regions; and Class 5: strongly reduced or loss of all regions. Data from three independent replicates are presented as bar graph. Abbreviations: P1: Meckel’s cartilage and palatoquadrate; P2: ceratohyal; P3-P7: ceratobranchial, and ep: ethmoid plate. Statistical analysis was performed using a two-way ANOVA test, p-values relative to control were always< 0.0001. |
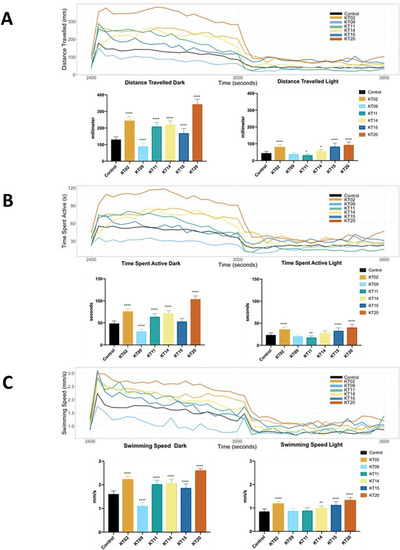
Locomotor behavior of larval zebrafish following exposure to various plant extracts for 5 days. The records of larval motion are shown in 30 second intervals over one cycle of a 10 min dark- 10 min light photoperiod. (A) Free swimming distance recorded during 10 min in the dark, followed by 10 min in the light. (B) Time spent active during 10-min intervals for each light state (dark or light). (C) Free swimming speed over 20 min of one dark- to-light cycle. Data are expressed as the mean ± SEM of three replicates (24 larvae per replicate). The asterisk represents a statistically significant difference when compared with the controls as described in Mat. and Meth.; * at p < 0.05, ** at p < 0.01 and **** at p < 0.0001 levels. |
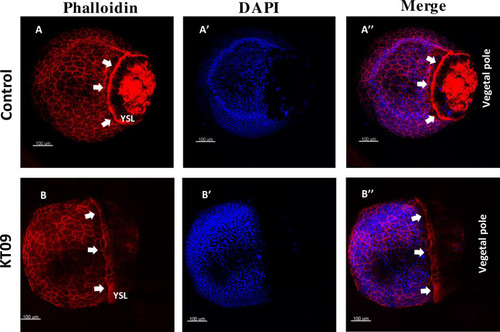
Delayed epiboly progression and disruption of F-actin organization caused by KT09 extract treatment. Embryos were treated with KT09 extract starting at 2hpf, while phalloidin and DAPI staining was performed at 80% epiboly (9hpf). (A-A”) A control embryo at 90% epiboly stage, with a dense marginal actin ring (white arrows). (B-B”) A representative embryo expose to KT09 extract shows epiboly retardation, and disruption of the EVL cortical F-actin, marginal actin ring and vegetal cortex F-actin. Scale bar: 100 μm. |
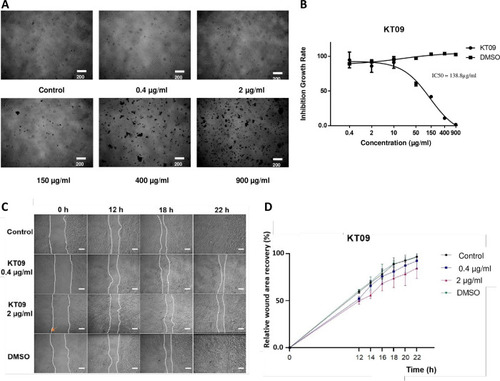
A. MEFs cell pictures after 48 hours of exposure to KT09 extract at different concentrations. B. Inhibition growth rate of MEFs cell exposed to KT09 extract in dose dependent manner (IC50 = 138.8 μg/mL). C. Pictures of the scratch taken at four different time points 0, 12, 18, and 22 hours after being exposed to KT09 extract. White dotted lines indicate the cell boundaries. (KT09 0.4 μg/mL inhibits 0% cell proliferation; KT09 2 μg/mL inhibits 10% cell proliferation; orange arrow: extract residue; scale bar: 200 μm). D. Graph displaying the percentage of wound recovery following KT09 extract exposure at various time points. |
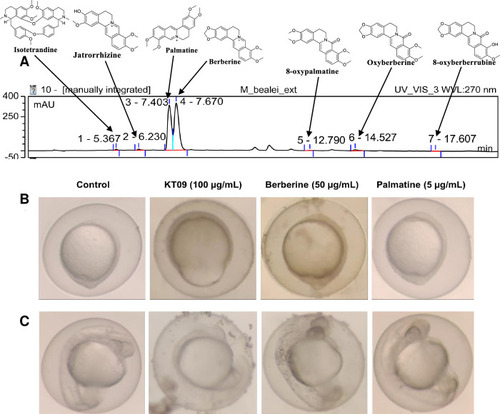
Chemical composition of the (A) HPLC chromatogram (at UV wavelength 270 nm) of the |
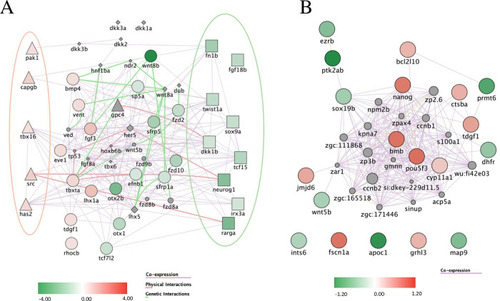
Pathways affected upon treatment with (A) Differentially expressed genes related to Wnt signaling upon KT09 treatment. A network was constructed based on the DEGs (p<0.05; fold-change > |1.4|). Shapes used indicate genes attributed to the canonical Wnt pathway (squares), the non-canonical pathway (triangles), both pathways (circles), or none (diamonds). The red and green ellipses highlight the genes that are specific to, respectively the non-canonical and the canonical Wnt pathway. (B) Differentially expressed genes upon KT09 treatment related to epiboly. A network was constructed based on the DEGs (p<0.05; fold-change > |1.3|). The color intensity indicates the fold-change of down-regulated (green) and up-regulated (red) genes by KT09 treatment. The lines correspond to relations of co-expression (violet), physical interaction between encoded proteins (pink), and genetic interaction (light green). |