
|
Fig 9
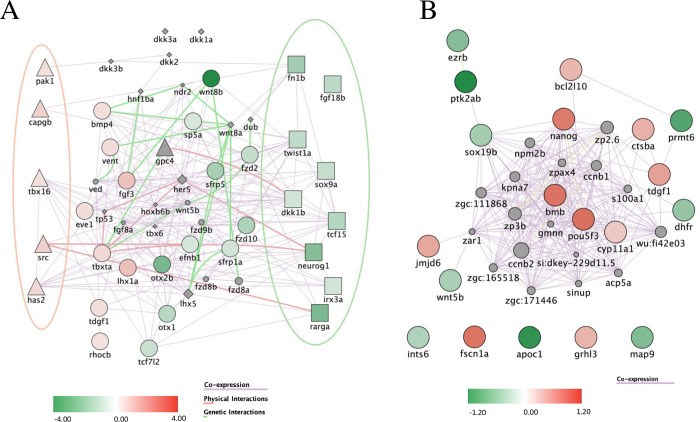
Pathways affected upon treatment with
(A) Differentially expressed genes related to Wnt signaling upon KT09 treatment. A network was constructed based on the DEGs (p<0.05; fold-change > |1.4|). Shapes used indicate genes attributed to the canonical Wnt pathway (squares), the non-canonical pathway (triangles), both pathways (circles), or none (diamonds). The red and green ellipses highlight the genes that are specific to, respectively the non-canonical and the canonical Wnt pathway. (B) Differentially expressed genes upon KT09 treatment related to epiboly. A network was constructed based on the DEGs (p<0.05; fold-change > |1.3|). The color intensity indicates the fold-change of down-regulated (green) and up-regulated (red) genes by KT09 treatment. The lines correspond to relations of co-expression (violet), physical interaction between encoded proteins (pink), and genetic interaction (light green).