
|
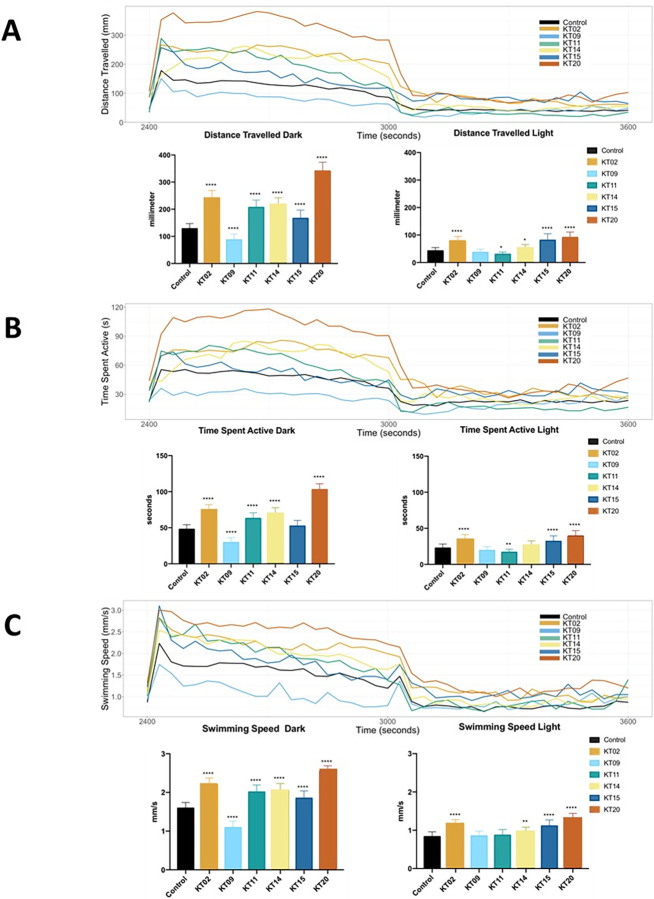
Fig 5 Locomotor behavior of larval zebrafish following exposure to various plant extracts for 5 days.
The records of larval motion are shown in 30 second intervals over one cycle of a 10 min dark- 10 min light photoperiod. (A) Free swimming distance recorded during 10 min in the dark, followed by 10 min in the light. (B) Time spent active during 10-min intervals for each light state (dark or light). (C) Free swimming speed over 20 min of one dark- to-light cycle. Data are expressed as the mean ± SEM of three replicates (24 larvae per replicate). The asterisk represents a statistically significant difference when compared with the controls as described in Mat. and Meth.; * at p < 0.05, ** at p < 0.01 and **** at p < 0.0001 levels.