
Image
|
Figure Caption
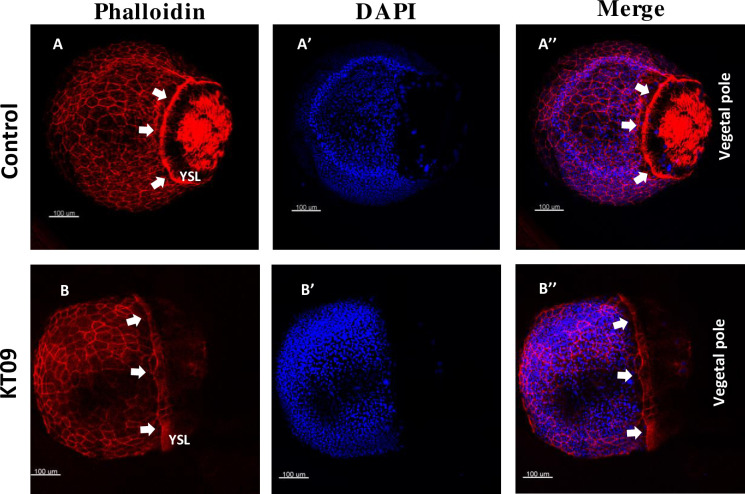
Fig 6 Delayed epiboly progression and disruption of F-actin organization caused by KT09 extract treatment.
Embryos were treated with KT09 extract starting at 2hpf, while phalloidin and DAPI staining was performed at 80% epiboly (9hpf). (A-A”) A control embryo at 90% epiboly stage, with a dense marginal actin ring (white arrows). (B-B”) A representative embryo expose to KT09 extract shows epiboly retardation, and disruption of the EVL cortical F-actin, marginal actin ring and vegetal cortex F-actin. Scale bar: 100 μm.
Acknowledgments
This image is the copyrighted work of the attributed author or publisher, and
ZFIN has permission only to display this image to its users.
Additional permissions should be obtained from the applicable author or publisher of the image.
Full text @ PLoS One