
|
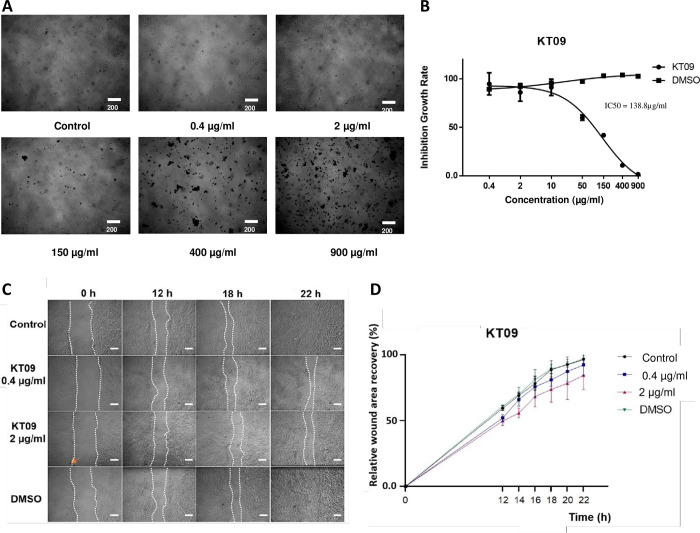
Fig 7
A. MEFs cell pictures after 48 hours of exposure to KT09 extract at different concentrations. B. Inhibition growth rate of MEFs cell exposed to KT09 extract in dose dependent manner (IC50 = 138.8 μg/mL). C. Pictures of the scratch taken at four different time points 0, 12, 18, and 22 hours after being exposed to KT09 extract. White dotted lines indicate the cell boundaries. (KT09 0.4 μg/mL inhibits 0% cell proliferation; KT09 2 μg/mL inhibits 10% cell proliferation; orange arrow: extract residue; scale bar: 200 μm). D. Graph displaying the percentage of wound recovery following KT09 extract exposure at various time points.