
- Title
-
Expression of taste sentinels, T1R, T2R, and PLCß2, on the passageway for olfactory signals in zebrafish
- Authors
- Birdal, G., D'Gama, P.P., Jurisch-Yaksi, N., Korsching, S.I.
- Source
- Full text @ Chem. Senses
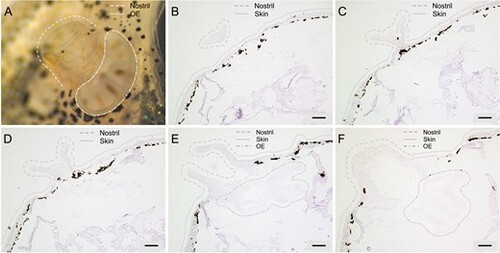
The funnel-like structure of the zebrafish nostril and its alignment with the OE. The topology of the zebrafish nostril is shown in a photograph and representative coronal sections. The nostril is usually present on 30–40 sections, of which five 10 µm cryostat sections are shown from anteriormost to posteriormost. (A) Photograph of zebrafish nostril taken under dissection microscope (dashed lines), the OE (enclosed in dash-dotted lines) is partially visible below the nasal outlet. (B) Appearance of the coronal sections of the nostrils (enclosed in dashed lines) at the most anterior positions where the connection of the nostril to the head skin (indicated with dotted lines) is not visible yet. (C) The widening of the opening of the nostril and the connection of the nostril to the head skin is observed at more posterior sections. (D) Further widening of the opening of the nostril and the connection of the nostril to the head skin is observed at further posterior sections. (E) The opening of the nostril to the OE is observed in sections where both the nostril and the OE (enclosed in dash-dotted lines) are visible. (F) Coronal sections of the nostrils and the OE at the most posterior positions show the closed parts of the nostril, where water is funneled through contacting the OE before it seeps out of the posterior opening (posterior nostril). Scale bars are 100 µm. |
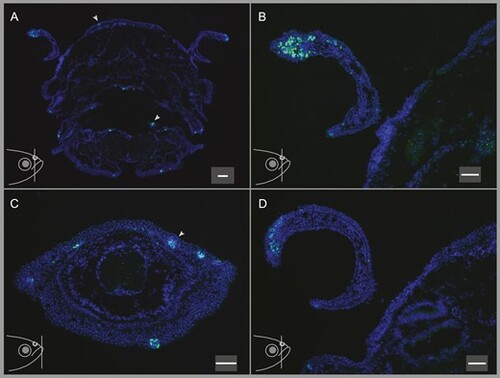
In situ hybridization of PLCβ2 to the nostrils, lower lip, oral cavity, and top head skin shows the presence of taste buds in these organs. Fish head illustrations at the lower left corners of all panels show the approximate position of the coronal sections depicted in the respective panels. (A) PLCβ2 staining of the taste buds on a coronal section of the head including the nostrils, oral cavity, and the top head skin shows that taste buds are present in the tissues of these organs in varying abundances. (B) Higher magnification of the nostril on the left-hand side on panel (A) shows numerous densely packed PLCβ2-expressing cells. (C) A coronal section of the lower lip exhibits several individual, well segregated taste buds. (D) Representative image of the nostril shows the dense expression of PLCβ2 on another animal, demonstrating the reproducibility of this observation. Scale bars are 100 µm (A) and 50 µm (B-D). |
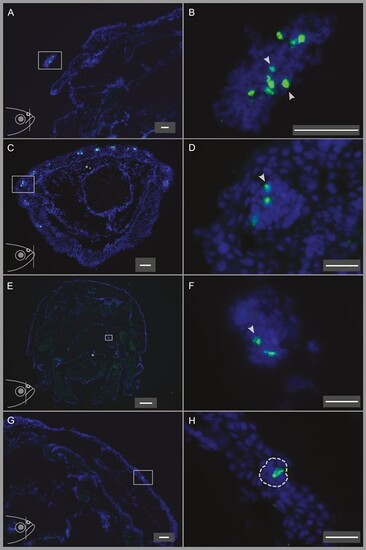
In situ hybridization of T1Rs to the nostrils, lower lip, oral cavity, and top head skin showing the different abundances of T1R-expressing cells in these organs. Fish head illustrations at the lower left corners of panels (A), (C), (E), and (G) show the approximate position of the coronal sections depicted in the respective panels. (A) A quarter of a coronal head section including the nostril (enclosed in the rectangle). (B) Higher magnification image of the nostril in panel (A), showing the abundant and dense T1R-expressing cells in the nostril. (C) A coronal section of the lower lip, T1R-expressing cells can be observed in several different taste buds in the lower lip. (D) Higher magnification of the area enclosed by the rectangle in panel (C), showing the T1R-labeled cells in that taste bud. (E) A coronal section of the head including the oral cavity. (F) Higher magnification of the area enclosed by the rectangle in panel (E), showing the only T1R-expressing cells observed in the oral cavity on this section. (G) A quarter of a coronal head section showing the single T1R-labeled cell in the top head skin on this section. (H) Higher magnification of the area enclosed by the rectangle in panel (G). The corresponding taste bud is enclosed by a dashed line. Scale bars are 50 µm (A–C, G), 20 µm (D, F, H), and 200 µm (E). |
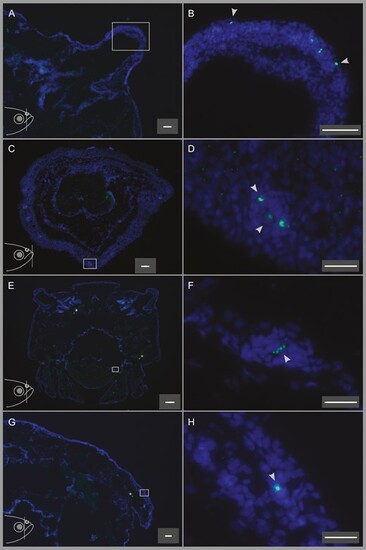
In situ hybridization of T2Rs to the nostrils, lower lip, oral cavity, and top head skin showing the different abundances of T2R-expressing cells on these organs. Fish head illustrations at the lower left corners of panels (A), (C), (E), and (G) show the approximate position of the coronal sections depicted in the respective panels. (A) A quarter of a coronal head section including the nostril (enclosed in the rectangle). (B) Higher magnification image of the nostril in panel a, showing T2R-expressing cells in the nostril. (C) A coronal section of the lower lip, several T2R-expressing taste cells can be observed in several different taste buds in the lower lip. (D) Higher magnification of the area enclosed by the rectangle in panel (C). (E) A coronal section of the head including the oral cavity. (F) Higher magnification of the area enclosed by the rectangle in panel (E), showing the single T2R-labeled cell in this section of the oral cavity. (G) A quarter of a coronal head section showing the single T2R-labeled cell in the top head skin on this section. (H) Higher magnification of the area enclosed by the rectangle in panel (G). Scale bars are 50 µm (A–C, G), 20 µm (D, F, H), and 200 µm (E). |
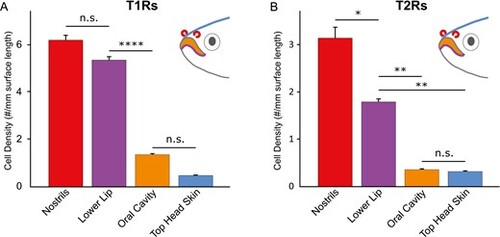
Quantitative evaluation shows highest density of T1R- and T2R-expressing cells in nostrils, compared to known taste regions lower lip and oral cavity. T1R- and T2R-expressing cells were quantified in 4 different regions, lower lip, oral cavity, head skin, and nostrils. The fish head illustrations depict the analyzed organs and are color-coded in accordance with the bar graphs. Significance is evaluated by 1-way ANOVA followed by Tukey’s post-hoc HSD test and given by asterisks: *P < 0.05; **P < 0.01; ****P < 0.0001; error bars represent SEM. All pairwise comparisons not depicted possess p values below 0.0001. (A) T1R-expressing cell density in nostrils is high, similar to that in the lower lip, and both are much higher than densities observed in oral cavity and top head skin. (B) The density of the T2R-expressing cells in the nostrils is significantly higher than that of the lower lip, and both are much higher than the density of T2R-expressing cells in oral cavity and top head skin. |
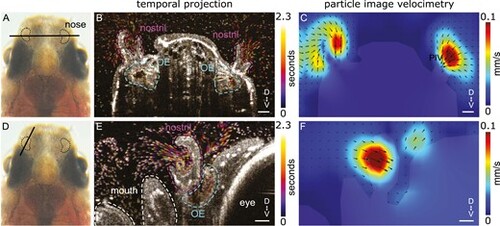
Directional fluid flow in the nostrils of adult zebrafish. (A, D): Dorsal view of an adult zebrafish head with the nose highlighted. The black bars indicate the location of the OCT recordings. Note that (A) represents a coronal and (D) a sagittal view of the zebrafish nose. (B, E): Projection of a 100 frames sequence (equivalent to 2.3 s) of OCT images of a deeply anesthetized adult zebrafish. Time 0 is indicated in dark magenta and time 2.3 s is indicated in yellow as shown in the false color scale. The anatomy of the nose, including the nostril and olfactory epithelium (OE), is indicated with dashed lines. Note the rapid movement of particles in the area surrounding the nostrils. Since the animal is deeply anesthetized, there is a reduced respiratory rate and little movement of particles around the mouth. (C, F): Particle image velocimetry analysis reveals the directionality and velocity of the fluid flow around the head of a deeply anesthetized zebrafish. Note that the highest velocity occurs at the inlet of the nostrils. Scale bar: 50 µm. |